Answered step by step
Verified Expert Solution
Link Copied!

Question

1 Approved Answer

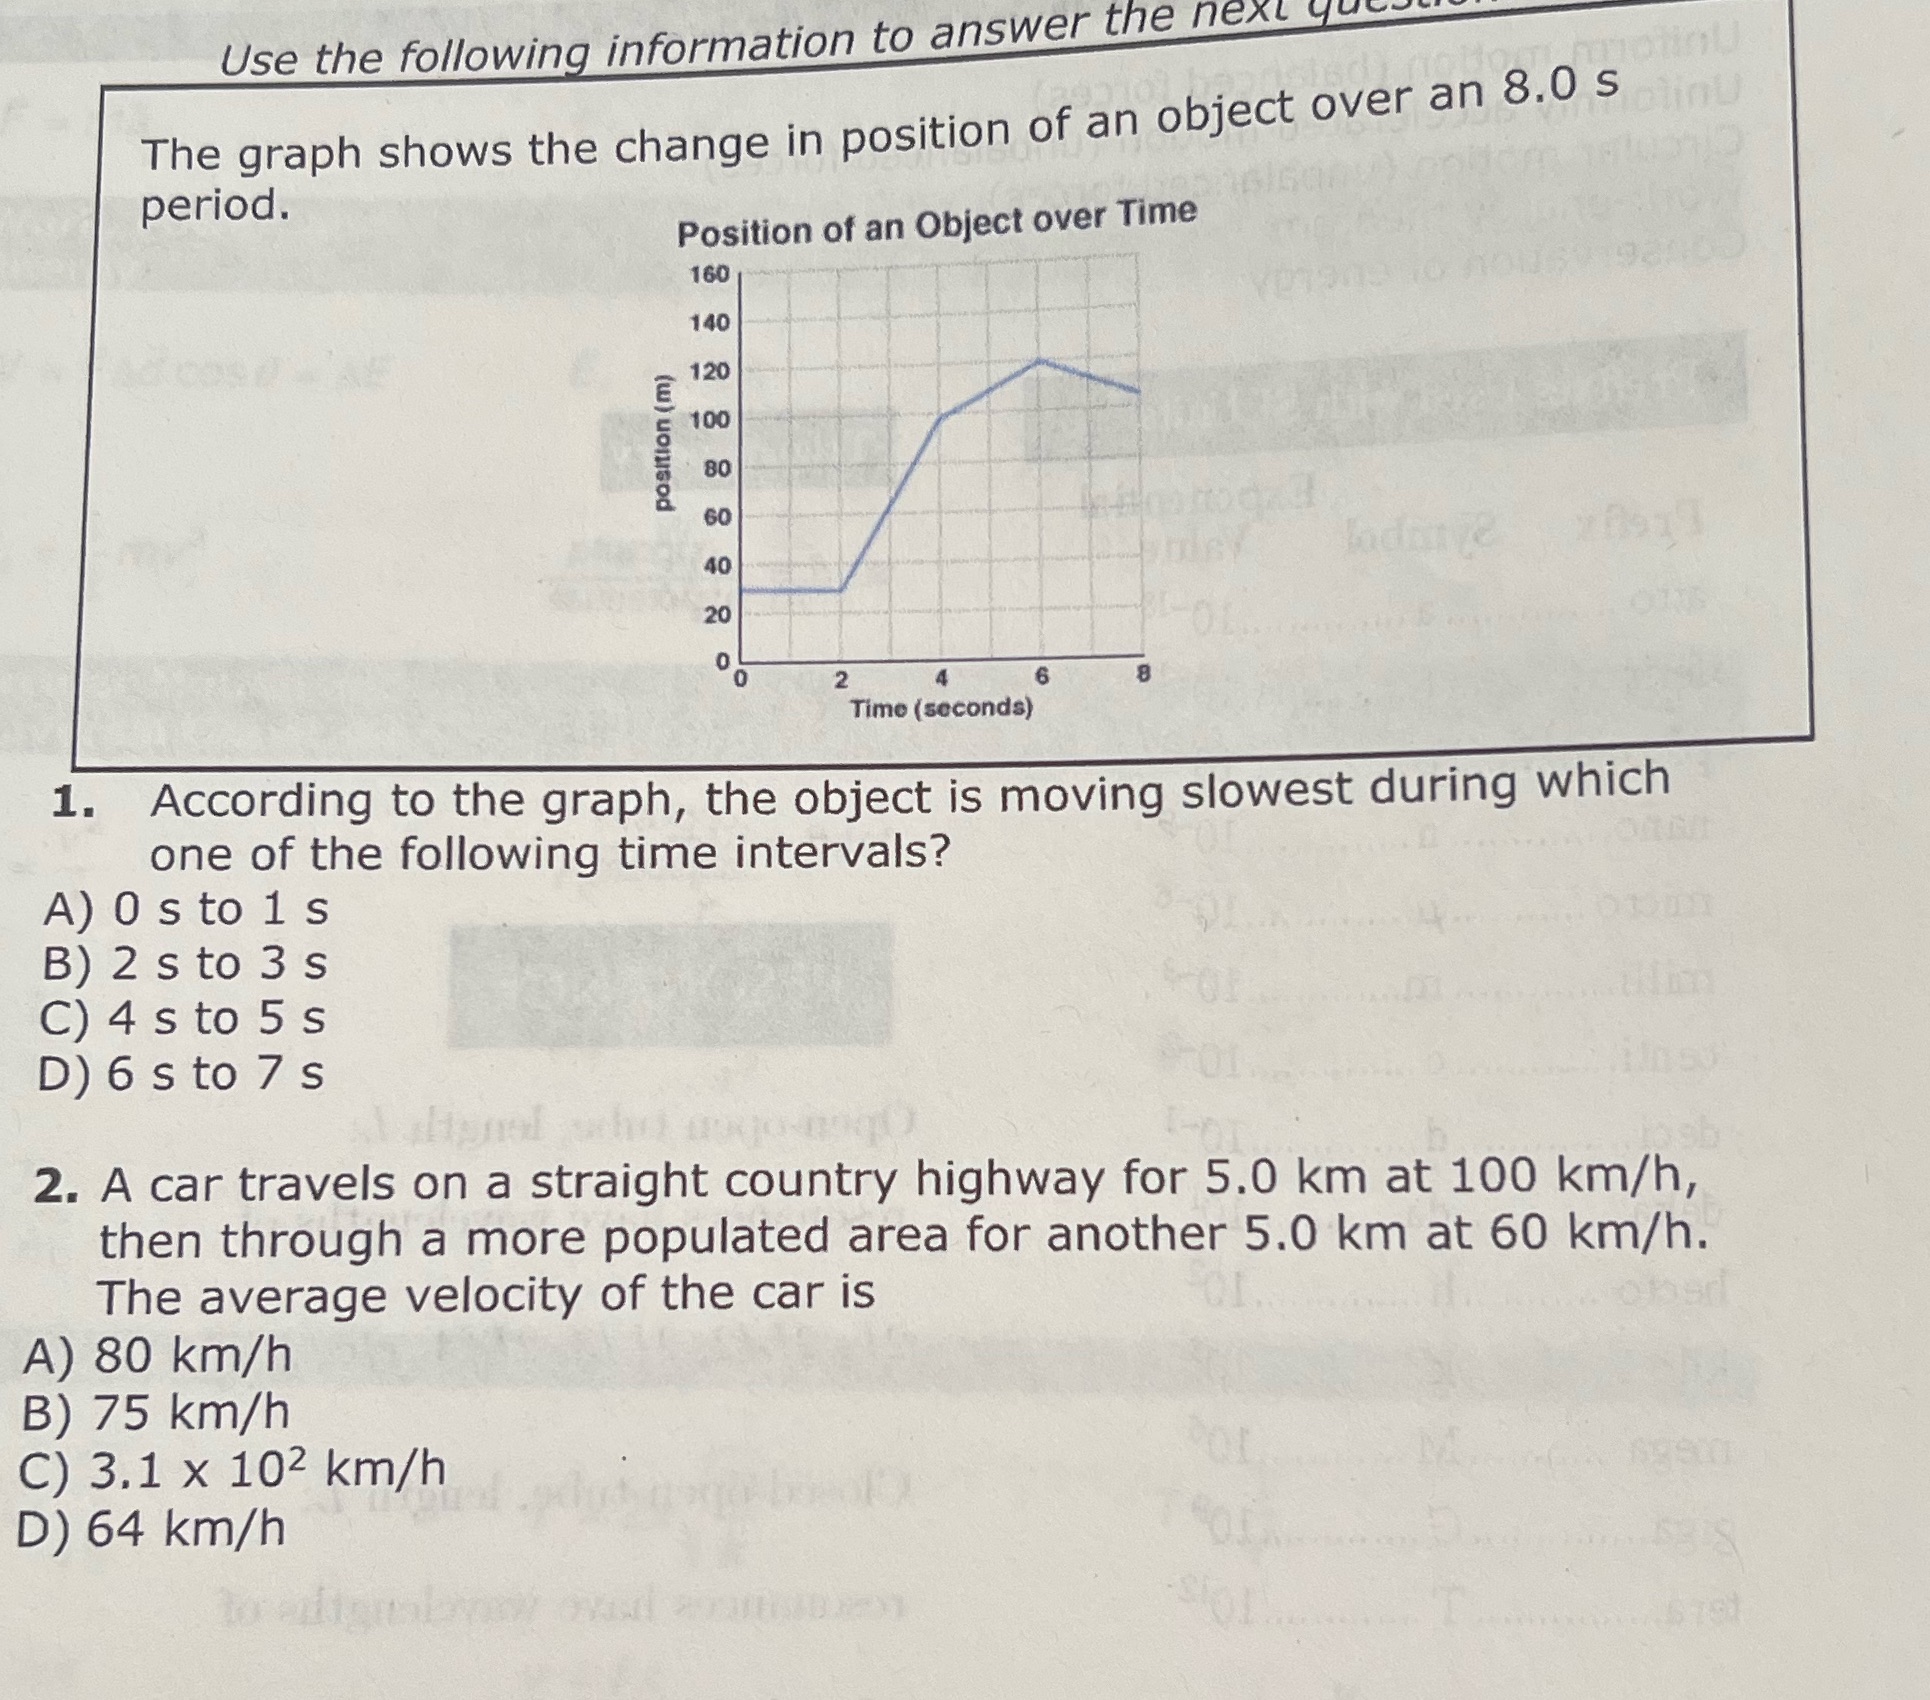
Help with 1,2 Use the following information to answer the next The graph shows the change in position of an object over an 8.0 s

Help with 1,2

image text in transcribed
Use the following information to answer the next The graph shows the change in position of an object over an 8.0 s period. Position of an Object over Time 160 140 120 100 position (m) 80 60 20 Time (seconds) 1. According to the graph, the object is moving slowest during which one of the following time intervals? A) O s to 1 s B) 2 s to 3 s C) 4 s to 5 s D) 6 s to 7 s 2. A car travels on a straight country highway for 5.0 km at 100 km/h, then through a more populated area for another 5.0 km at 60 km/h. The average velocity of the car is A) 80 km/h B) 75 km/h C) 3.1 x 10² km/h Pot D) 64 km/h

Step by Step Solution

There are 3 Steps involved in it

Step: 1

blur-text-image

Get Instant Access to Expert-Tailored Solutions

See step-by-step solutions with expert insights and AI powered tools for academic success

Step: 2

blur-text-image

Step: 3

blur-text-image

Ace Your Homework with AI

Get the answers you need in no time with our AI-driven, step-by-step assistance

Get Started

Recommended Textbook for

Physics

Authors: John D. Cutnell, Kenneth W. Johnson, David Young, Shane Stadler

11th Edition

1119539633, 9781119539636

More Books

Students also viewed these Physics questions

Question

How do we do subnetting in IPv6?Explain with a suitable example.

Answered: 1 week ago

Question

Explain the guideline for job description.

Answered: 1 week ago

Question

What is job description ? State the uses of job description.

Answered: 1 week ago

Question

What are the objectives of job evaluation ?

Answered: 1 week ago

Question

Write a note on job design.

Answered: 1 week ago