help with price-earnings snd market-to-book ratio and how to solve it please
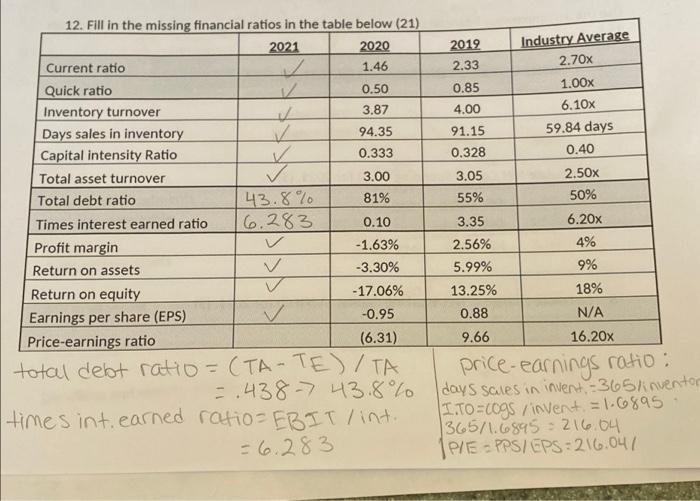
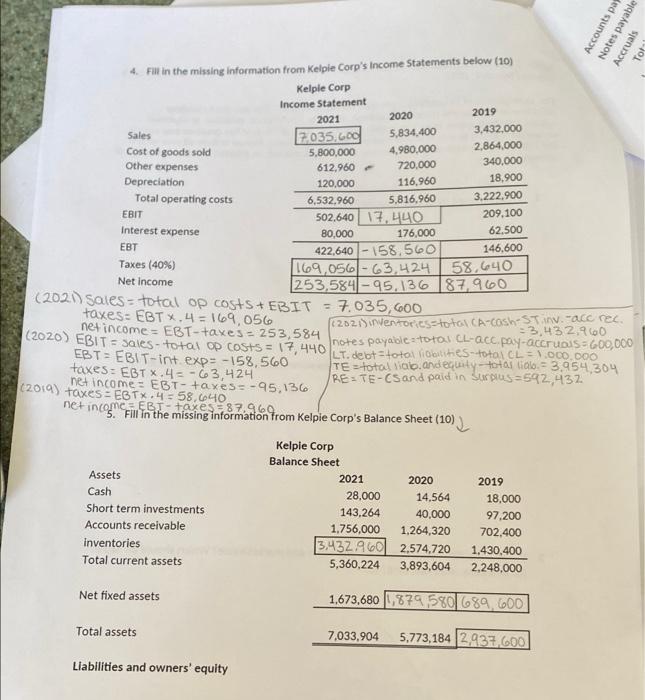
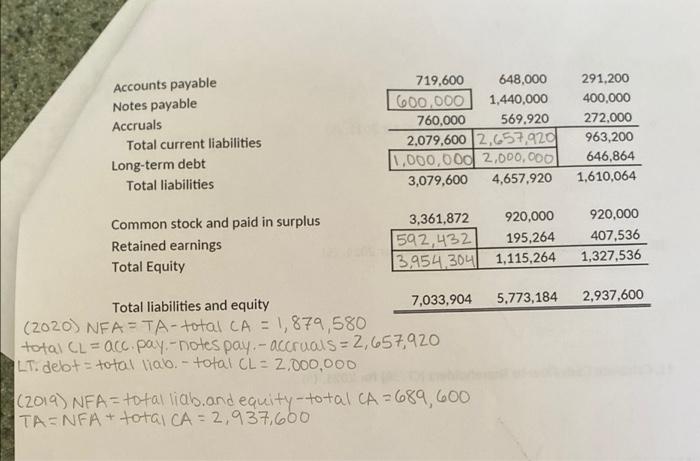
12. Fill in the missing financial ratios in the table below (21) 2021 2020 Current ratio 2 1.46 Quick ratio 12 0.50 Inventory turnover 3.87 Days sales in inventory V 94.35 Capital intensity Ratio 0.333 Total asset turnover 3.00 Total debt ratio 43.8% 81% Times interest earned ratio 16.283 0.10 Profit margin -1.63% Return on assets -3.30% Return on equity -17.06% Earnings per share (EPS) -0.95 Price-earnings ratio (6.31) total debt ratio = (TA-TE)/TA =.438-7 43.8% times int. earned ratio=EBIT / int. = 6.283 2019 Industry Average 2.33 2.70x 0.85 1.00x 4.00 6.10x 91.15 59.84 days 0.328 0.40 3.05 2.50x 55% 50% 3.35 6.20x 2.56% 4% 5.99% 9% 13.25% 18% 0.88 N/A 9.66 16.20x price-earnings ratio : days sales in invent-365/inventor I.TO=cogs/invent = 1.6895 1365/1.6895= 216.04 P/E - PPS/EPS: 216.047 Market-to-book ratio 1.08 1.28 2.90x Accounts par Notes payable Accruals Tot 4. Fall in the missing information from Kelpie Corp's Income Statements below (10) Kelple Corp Income Statement 2021 2020 2019 Sales 3,432.000 7,035,600 5,834,400 Cost of goods sold 5,800,000 4.980.000 2,864,000 Other expenses 612,960 720,000 340,000 Depreciation 120,000 116,960 18.900 Total operating costs 6,532.960 5,816,960 3.222.900 EBIT 502,640 17.440 209.100 Interest expense 80,000 176,000 62.500 EBT 422,640 - 158.560 146,600 Taxes (40%) 169,056 - 63,424 58.640 Net Income 253,584-95,136 187,960 (2021) Sales - total op costs + EBIT = taxes: EBT*.4 = 169,056 7.035,600 - EBT- 6202 Dentories to a CA-cosh-stin-acc rec. = EBT = EBIT-int. exp= -158,560 LT.deottotoi liitines-toto L = 1.000.000 taxes: EBTX.4 = -63,424 TE-total lab and equity-totas lialo. = 3,954,304 (2019) taxes - EBTX.4 = 58,640 net income: EBT-taxes= -95,136 RE: TE-Csand paid in Surplus=542,432 net income EBT-taxes = 87.969 3. Fill in the missing information from Kelpie Corp's Balance Sheet (10) Kelpie Corp Balance Sheet Assets 2021 2020 2019 Cash 28,000 14,564 18.000 Short term investments 143,264 40,000 97,200 Accounts receivable 1.756,000 1,264,320 702,400 inventories 3432.960 2.574.720 1,430,400 Total current assets 5,360,224 3,893,604 2.248.000 (2020) EBIT = sales - total tax costs=375446 notes payable total cu-acc.pay-accruals 600.000 Net fixed assets 1.673,680 1,879,580 689 600 Total assets 7,033,904 5.773,184 2,937,600 Liabilities and owners' equity Accounts payable Notes payable Accruals Total current liabilities Long-term debt Total liabilities 719,600 648,000 600,000 1,440,000 760,000 569.920 2,079,600 2,657,920 1,000,000 2,000,000 3,079,600 4,657,920 291,200 400,000 272.000 963,200 646,864 1,610,064 Common stock and paid in surplus Retained earnings Total Equity 3,361,872 920,000 1592, 432 195,264 3,954.304 1,115,264 920,000 407,536 1,327,536 5,773,184 2,937,600 Total liabilities and equity 7,033,904 (2020) NFA = TA- total CA = 1,879,580 total CL = acc. pay-notes pay.- accruals = 2,657,920 LT.delot = total vial. - total CL - 2.000.000 (2019) NFA = total liab.and equity-total CA-689,600 ITA=NFA + total CA = 2,937,660 12. Fill in the missing financial ratios in the table below (21) 2021 2020 Current ratio 2 1.46 Quick ratio 12 0.50 Inventory turnover 3.87 Days sales in inventory V 94.35 Capital intensity Ratio 0.333 Total asset turnover 3.00 Total debt ratio 43.8% 81% Times interest earned ratio 16.283 0.10 Profit margin -1.63% Return on assets -3.30% Return on equity -17.06% Earnings per share (EPS) -0.95 Price-earnings ratio (6.31) total debt ratio = (TA-TE)/TA =.438-7 43.8% times int. earned ratio=EBIT / int. = 6.283 2019 Industry Average 2.33 2.70x 0.85 1.00x 4.00 6.10x 91.15 59.84 days 0.328 0.40 3.05 2.50x 55% 50% 3.35 6.20x 2.56% 4% 5.99% 9% 13.25% 18% 0.88 N/A 9.66 16.20x price-earnings ratio : days sales in invent-365/inventor I.TO=cogs/invent = 1.6895 1365/1.6895= 216.04 P/E - PPS/EPS: 216.047 Market-to-book ratio 1.08 1.28 2.90x Accounts par Notes payable Accruals Tot 4. Fall in the missing information from Kelpie Corp's Income Statements below (10) Kelple Corp Income Statement 2021 2020 2019 Sales 3,432.000 7,035,600 5,834,400 Cost of goods sold 5,800,000 4.980.000 2,864,000 Other expenses 612,960 720,000 340,000 Depreciation 120,000 116,960 18.900 Total operating costs 6,532.960 5,816,960 3.222.900 EBIT 502,640 17.440 209.100 Interest expense 80,000 176,000 62.500 EBT 422,640 - 158.560 146,600 Taxes (40%) 169,056 - 63,424 58.640 Net Income 253,584-95,136 187,960 (2021) Sales - total op costs + EBIT = taxes: EBT*.4 = 169,056 7.035,600 - EBT- 6202 Dentories to a CA-cosh-stin-acc rec. = EBT = EBIT-int. exp= -158,560 LT.deottotoi liitines-toto L = 1.000.000 taxes: EBTX.4 = -63,424 TE-total lab and equity-totas lialo. = 3,954,304 (2019) taxes - EBTX.4 = 58,640 net income: EBT-taxes= -95,136 RE: TE-Csand paid in Surplus=542,432 net income EBT-taxes = 87.969 3. Fill in the missing information from Kelpie Corp's Balance Sheet (10) Kelpie Corp Balance Sheet Assets 2021 2020 2019 Cash 28,000 14,564 18.000 Short term investments 143,264 40,000 97,200 Accounts receivable 1.756,000 1,264,320 702,400 inventories 3432.960 2.574.720 1,430,400 Total current assets 5,360,224 3,893,604 2.248.000 (2020) EBIT = sales - total tax costs=375446 notes payable total cu-acc.pay-accruals 600.000 Net fixed assets 1.673,680 1,879,580 689 600 Total assets 7,033,904 5.773,184 2,937,600 Liabilities and owners' equity Accounts payable Notes payable Accruals Total current liabilities Long-term debt Total liabilities 719,600 648,000 600,000 1,440,000 760,000 569.920 2,079,600 2,657,920 1,000,000 2,000,000 3,079,600 4,657,920 291,200 400,000 272.000 963,200 646,864 1,610,064 Common stock and paid in surplus Retained earnings Total Equity 3,361,872 920,000 1592, 432 195,264 3,954.304 1,115,264 920,000 407,536 1,327,536 5,773,184 2,937,600 Total liabilities and equity 7,033,904 (2020) NFA = TA- total CA = 1,879,580 total CL = acc. pay-notes pay.- accruals = 2,657,920 LT.delot = total vial. - total CL - 2.000.000 (2019) NFA = total liab.and equity-total CA-689,600 ITA=NFA + total CA = 2,937,660


