

Answered step by step
Verified Expert Solution
Question
1 Approved Answer
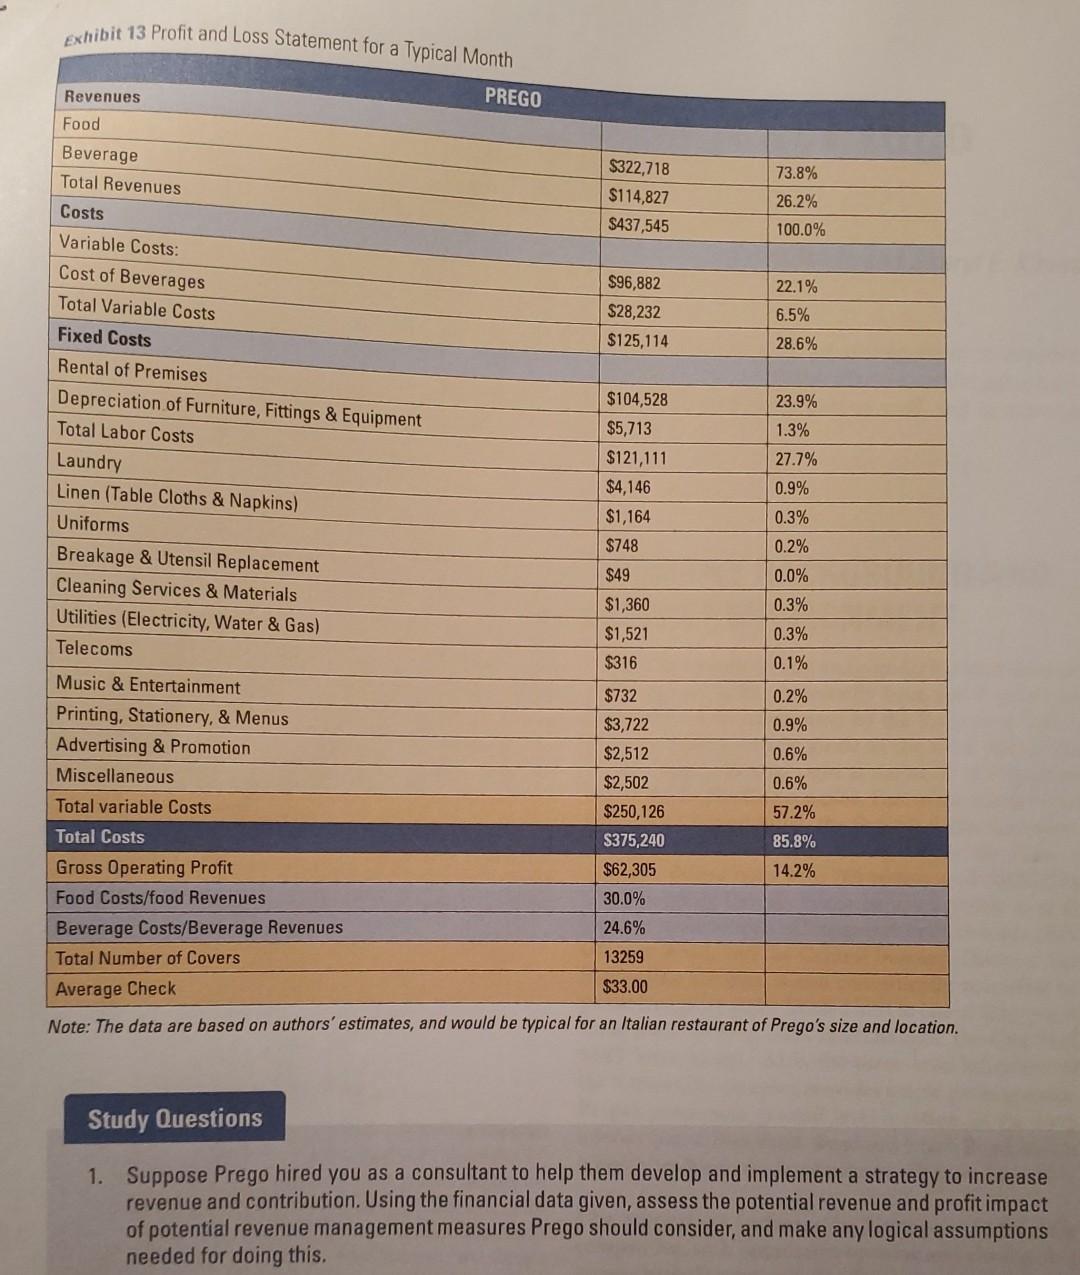
help with question 1 Exhibit 13 Profit and Loss Statement for a Typical Month PREGO Revenues Food Beverage $322,718 73.8% Total Revenues $114,827 26.2% Costs
help with question 1
Exhibit 13 Profit and Loss Statement for a Typical Month PREGO Revenues Food Beverage $322,718 73.8% Total Revenues $114,827 26.2% Costs S437,545 100.0% Variable Costs: Cost of Beverages $96,882 22.1% Total Variable Costs $28,232 6.5% Fixed Costs $125,114 28.6% Rental of Premises Depreciation of Furniture, Fittings & Equipment $104,528 23.9% Total Labor Costs $5,713 1.3% $121,111 27.7% Laundry $4,146 0.9% Linen (Table Cloths & Napkins) $1,164 0.3% Uniforms $748 0.2% Breakage & Utensil Replacement $49 0.0% Cleaning Services & Materials $1,360 Utilities (Electricity, Water & Gas) $1,521 0.3% Telecoms $316 0.1% Music & Entertainment $732 0.2% Printing, Stationery & Menus $3,722 0.9% Advertising & Promotion $2,512 0.6% Miscellaneous $2,502 0.6% Total variable Costs $250,126 57.2% Total Costs $375,240 85.8% Gross Operating Profit $62,305 14.2% Food Costs/food Revenues 30.0% 24.6% Beverage Costs/Beverage Revenues 13259 Total Number of Covers $33.00 Average Check Note: The data are based on authors' estimates, and would be typical for an Italian restaurant of Prego's size and location. 0.3% Study Questions 1. Suppose Prego hired you as a consultant to help them develop and implement a strategy to increase revenue and contribution. Using the financial data given, assess the potential revenue and profit impact of potential revenue management measures Prego should consider, and make any logical assumptions needed for doing this. Exhibit 13 Profit and Loss Statement for a Typical Month PREGO Revenues Food Beverage $322,718 73.8% Total Revenues $114,827 26.2% Costs S437,545 100.0% Variable Costs: Cost of Beverages $96,882 22.1% Total Variable Costs $28,232 6.5% Fixed Costs $125,114 28.6% Rental of Premises Depreciation of Furniture, Fittings & Equipment $104,528 23.9% Total Labor Costs $5,713 1.3% $121,111 27.7% Laundry $4,146 0.9% Linen (Table Cloths & Napkins) $1,164 0.3% Uniforms $748 0.2% Breakage & Utensil Replacement $49 0.0% Cleaning Services & Materials $1,360 Utilities (Electricity, Water & Gas) $1,521 0.3% Telecoms $316 0.1% Music & Entertainment $732 0.2% Printing, Stationery & Menus $3,722 0.9% Advertising & Promotion $2,512 0.6% Miscellaneous $2,502 0.6% Total variable Costs $250,126 57.2% Total Costs $375,240 85.8% Gross Operating Profit $62,305 14.2% Food Costs/food Revenues 30.0% 24.6% Beverage Costs/Beverage Revenues 13259 Total Number of Covers $33.00 Average Check Note: The data are based on authors' estimates, and would be typical for an Italian restaurant of Prego's size and location. 0.3% Study Questions 1. Suppose Prego hired you as a consultant to help them develop and implement a strategy to increase revenue and contribution. Using the financial data given, assess the potential revenue and profit impact of potential revenue management measures Prego should consider, and make any logical assumptions needed for doing thisStep by Step Solution
There are 3 Steps involved in it
Step: 1

Get Instant Access to Expert-Tailored Solutions
See step-by-step solutions with expert insights and AI powered tools for academic success
Step: 2

Step: 3
Ace Your Homework with AI
Get the answers you need in no time with our AI-driven, step-by-step assistance
Get Started
Return Distributions In Finance
Authors: Stephen Satchell, John Knight
1st Edition
0750647515, 978-0750647519