Answered step by step
Verified Expert Solution
Question
1 Approved Answer
Help with the following 2 questions please Net Present Value Analysis Annasam Company believes that it can improve its cost per unit if it invests
Help with the following 2 questions please 

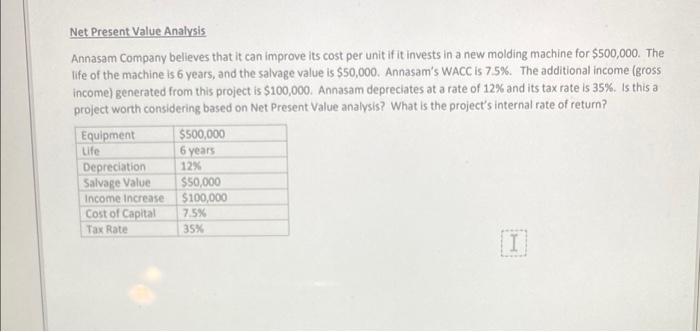
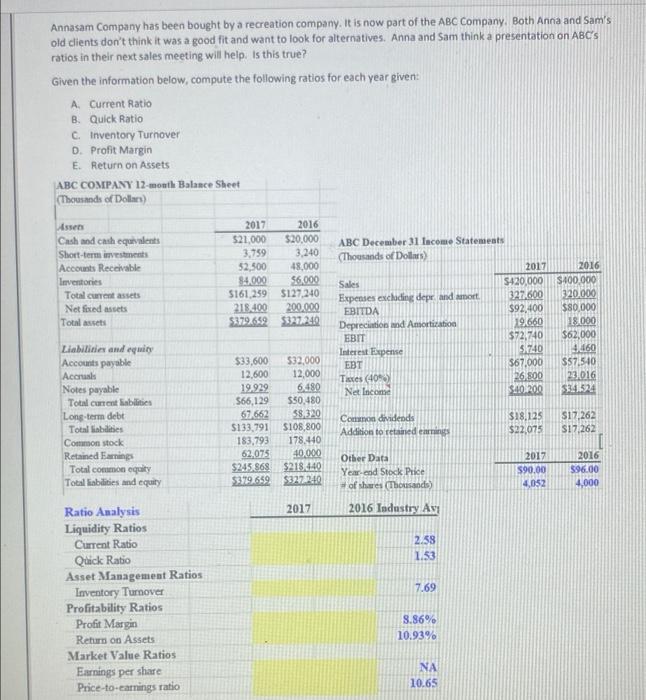
Net Present Value Analysis Annasam Company believes that it can improve its cost per unit if it invests in a new molding machine for $500,000. The life of the machine is 6 years, and the salvage value is $50,000. Annasam's WACC is 7.5%. The additional income (gross income) generated from this project is $100,000. Annasam depreciates at a rate of 12% and its tax rate is 35%. Is this a project worth considering based on Net Present Value analysis? What is the project's internal rate of return? Equipment $500,000 6 years Depreciation 12% Salvage Value $50,000 Income increase $100,000 Cost of Capital 7.5% Tax Rate 35% Life Annasam Company has been bought by a recreation company. It is now part of the ABC Company. Both Anna and Sam's old dients don't think it was a good fit and want to look for alternatives. Anna and Sam think a presentation on ABC's ratios in their next sales meeting will help. Is this true? Given the information below, compute the following ratios for each year given A. Current Ratio B. Quick Ratio C. Inventory Turnover D. Profit Margin E. Return on Assets ABC COMPANY 12-mouth Balance Sheet (Thousands of Dollars) Cashmod cash equivalents Short-term investments Accounts Receivable Inventories Total current assets Net fixed assets Total assets 2017 2016 $21,000 $20.000 3,759 3,240 52,500 48.000 84.000 $6,000 $161.259 $127.240 218 400 200.000 5372652 5327240 ABC December 31 Income Statements (Thousands of Dolls 2017 Sales $420,000 Expenses excluding dep, and mort 3277600 EBITDA $92,400 Depreciation and Amortization 19.660 EBIT $72,740 Interest Expense 5740 EBT $67.000 Taxes (40) 26.800 Net Income $10.200 2016 $400.000 320.000 $80.000 18.000 $62,000 04160 $57510 22,016 $34524 Liabilities and equity Accounts payable Acons Notes payable Total current abilities Long-term debt Total liabilities Common stock Retained Earnings Total common equity Total liabilities and equity $33,600 12,600 19.939 566,129 67662 $133,791 183,793 62.075 $245.868 $99.659 $32,000 12,000 6480 $50,480 38.320 $108,800 178,440 40.000 $218.440 $327240 Comos dividends Addition to retained earnings $18.125 $22.075 $17.262 $17,262 Other Data Year-end Stock Proe of shares (Thousands) 2017 $90.00 4,052 2016 596.00 4,000 2017 2016 Industry As 2.58 1.53 7.69 Ratio Analysis Liquidity Ratios Current Ratio Quick Ratio Asset Management Ratios Inventory Turnover Profitability Ratios Profit Margin Return on Assets Market Value Ratios Earnings per share Price-to-camnings ratio 8.86% 10.93% NA 10.65 

Step by Step Solution
There are 3 Steps involved in it
Step: 1

Get Instant Access to Expert-Tailored Solutions
See step-by-step solutions with expert insights and AI powered tools for academic success
Step: 2

Step: 3

Ace Your Homework with AI
Get the answers you need in no time with our AI-driven, step-by-step assistance
Get Started


