HELP!HELP!HELP!HELP!HELP!HELP!HELP!HELP!HELP!HELP!HELP!HELP!HELP!HELP!HELP!HELP!HELP!HELP!HELP!HELP!
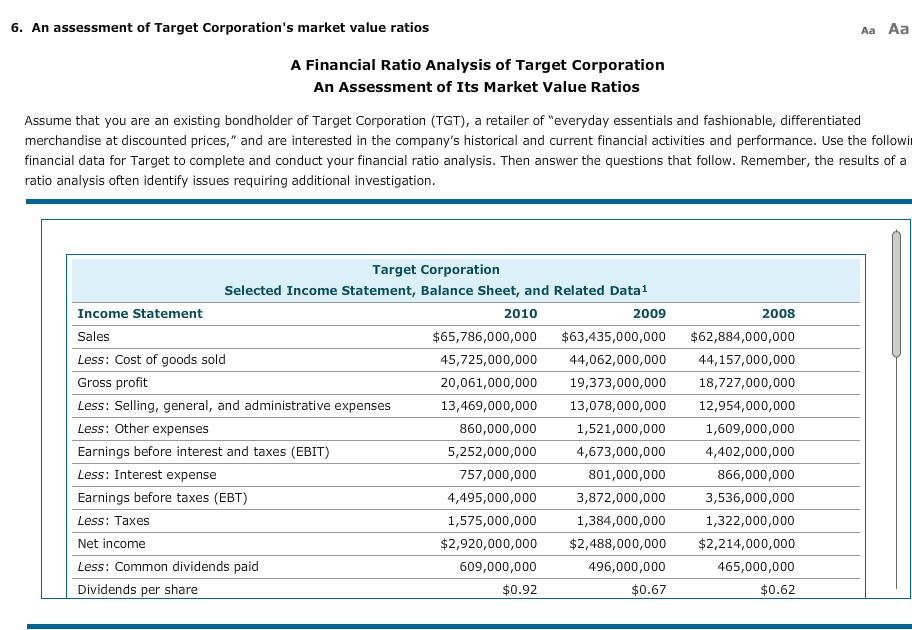
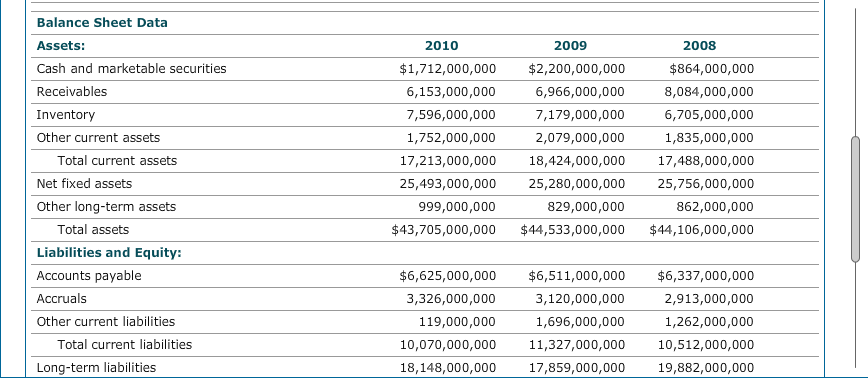
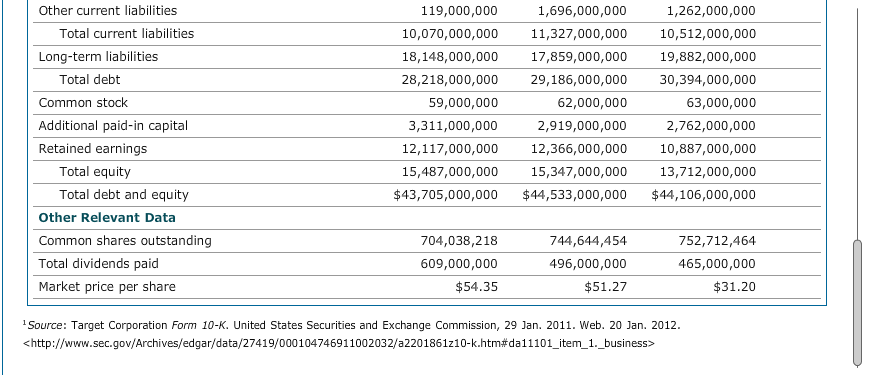
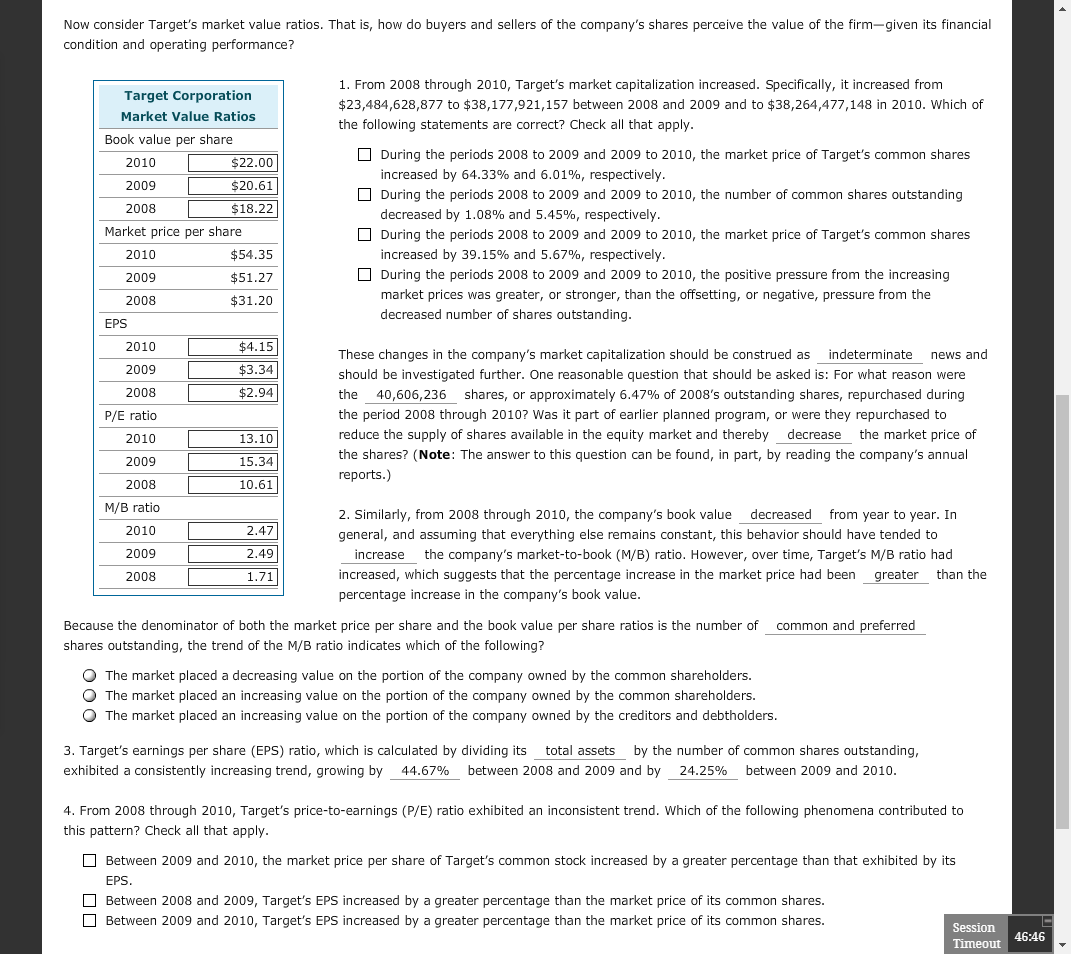
E. An assessment of Target Corporation's market value ratios A Financial Ratio Analysis of Target lCorporation An Assessment of Its Market Value Ratios Assume that you are an existing bondholder of Target Corporation {TGT}, a retailer of "everyday essentials and fashionable, differentiated merchandise at discounted prices," and are interested in the company's historical and cement financial activities and performance. Use the followil financial data for Target to complete and conduct your financial ratio analysis. Then answer the questions that follow. Remember, the results of' a ratio analysis often identify issues requiring additional investigation. mAa Target Corporation Selected Income Statement, Balance Sheet, and Related Data1 Income Statement 2010 2009 2008 Sales $65,?06.000,000 $63,435,000.000 $62,004.000,000 Less: Cost of goods sold 45.225.000.000 44.052.000.000 44, 151000.000 Gross prot 20.061.000.000 19.323.000.000 18.222.000.000 Less: Selling. general, and administrative expenses 13.469.000.000 13.020.000.000 12.954.000.000 Less: Other expenses 060,000,000 1,521,000,000 1,609,000,000 Earnings before interest and taxes {EBIT) 5,252,000,000 4,623,000,000 4,402,000,000 Less: Interest expense 252,000,000 001,000,000 066,000,000 Earnings before taxes {EBT} 4,495,000,000 3.0?2,000.000 3,536,000,000 Less: Taxes 1,525,000,000 1,304,000,000 1,322,000,000 Net income 352.920.000.000 352.430.000.000 352.214.000.000 Less: Common dividends paid 609,000,000 496,000,000 465,000,000 Dividends per share $0.92 $0.6? $0.62 Balance Sheel: Data Assets: Cash and marketable securities 2010 $ 1.?1 2, 000,000 2009 $2.200.000,000 2008 $ 864-. 000,000 Receivables Inventory Other current assets Total current assets Net fixed assets 5,153,000,000 2,595,000,000 1,25 2,000,000 12,213,000,000 25,493,000,000 5,955,000,000 2,129,000,000 2,029,000,000 1s,424,000,000 25,250,000,000 0,084,000,000 5,20 5,000,000 1,03 5,000,000 12,430,000,000 25,?55,000,000 Other lung-term assets Total assets 999,000,000 $43,?05,000,000 029,000,000 $44,533.000.000 05 2,000,000 $44,106,000,000 Liabilities and Equity: Accounts payable $5.525,000,000 $6.511.000,000 $5.33?,000,000 Accruals Other current liabilities 3,325,000,000 1 19,000,000 3,120,000,000 1,595,000,000 2,913,000,000 1,25 2,000,000 T0ta| current liabiliijes Long-term liabilities 10,0?0,000,000 18. 140,000,000 1 1,32?,000,000 1?,859.000,000 10 ,5 1 2, 000,000 19.832.000,000 Other cuner'lt liabilities 119,000,000 1,696,000,000 1,262,000,000 Total current liabilities 10,0?0,000,000 11,32?,000,000 10,512,000,000 Long-term liabilities 18,148,000,000 1?,859,000,000 19,832,000,000 Total debt 28,218,000,000 29,136,000,000 30,394,000,000 Common stock 59,000,000 62,000,000 63,000,000 Additional paid-in capital 3,311,000,000 2,919,000,000 2,?62,000,000 Retained earnings 12,11T,000,000 12,366,000,000 10,83?,000,000 Total equity 15,4B?,000,000 15,34?,000,000 13,?12,000,000 Total debt and equity $43,?05,000,000 Sid-4,533,000,000 $44,106,000,000 other Relevant Data Common shares outstanding ?04,033,218 244,644,454 ?52,?12,464 Total dividends paid 609,000,000 496,000,000 465,000,000 Market price per share $54.35 $51.27 $31.20 1.'Sour'oe: Target Corporation Form .I-K. United States Securities and Exchange Commillion, 29 Jan. 2011. Web. 2|] Jan. 2012. chttp:ffmmaecgoufmhiuesfedgarfdata?"BflM?46911002032fa2201861210-k.htm#dall101_itern_1._business:=v Now consider Target's market value ratios. That is, how do buyers and sellers of the company's shares perceive the value of the firmgiven its financial condition and operating performance? _ 1. From 2008 through 2010, Target's market capitalization increased. Specically, it increased from Target Corporatlon . . I'll: I _ $23,484,528,8?7 to $33,172,921,157 between 2008 and 2009 and to $33,264,4??,l.48 In 2010. Which of Ma et Va ue Ratlos the following statements are correct? Check all that apply. Book value per share 2010$2200 _ During the periods 2008 to 2009 and 2009 to 2010, the market price of Target's common shares increased by 64.33% and 6.01%, respectively. $' During the periods 2008 to 2009 and 2009 to 2010, the number of common shares outstanding 2008 $1822 decreased by 1.08% and 5.45%, respectively. Market price per share During the periods 2008 to 2009 and 2009 to 2010, the market price of Target's common shares 2010 $54.35 increased by 39.15% and 5.62%, respectively. 2509 $5127 During the periods 2008 to 2009 and 2009 to 2010, the positive pressure from the increasing 2003 $3120 market prices was greater, or stronger, than the offsetting, or negative, pressure from the EPS decreased number of shares oulstanding. 2010 $4. 15 . , . . . . . These changes In the companys market capitalization should be construed as Indeterminate news and 2009 $334 should be investigated further. One reasonable question that should be asked is: For what reason were 2303 $2-94 the 40,606,236 shares, or approximately 6.42% of 2008's outstanding shares, repurchased during PIE ratio the period 2008 through 2010? Was it part of earlier planned program, or were they repurchased to 2510 1110 reduce the supply of shares available in the equity market and thereby decrease the market price of 2009 15 34 the shares? (Note: The answer to this question can be found, in part, by reading the company's annual reports.) 2008 10.61 [MB ratio . . , 2. Similarly, from 2008 through 2010, the company 5 book value decreased from year to year. In 2510 2-47 general, and assuming that everything else remains constant, this behavior should have tended to 2009 2.49 increase the company's market-to-book (NIB) ratio. However, over time, Target's MIB ratio had 2303 131 increased, which suggests that the percentage increase in the market price had been greater than the percentage increase in the company's book value. Because the denominator of both the market price per share and the book value per share ratios is the number of common and preferred shares oulstanding, the trend of the M18 ratio indicates which of the following? 0 The market placed a decreasing value on the portion of the company owned by the common shareholders. O The market placed an increasing value on the portion of the company owned by the common shareholders. O The market placed an increasing value on the portion of the company owned by the creditors and debtholders. 3. Target's earnings per share {EPS} ratio, which is calculated by dividing its total assets by the number of' common shares oulstanding, exhibited a consistently increasing trend, growing by 44.6?'% between 2008 and 2009 and by 24.25% between 2009 and 2010. 4. From 2008 through 2010, Target's price-to-earnings (PIE) ratio exhibited an inconsistent trend. Which of the following phenomena contributed to this pattern? Check all that apply. Between 2009 and 2010, the market price per share of Target's common stock increased by a greater percentage than that exhibited by its EPS. Between 2008 and 2009, Target's EPS increased by a greater percentage than the market price of i3 common shares. Between 2009 and 2010, Target's EPS increased by a greater percentage than the market price of i3 common shares. Session Timeout 46:47