Answered step by step
Verified Expert Solution
Question
1 Approved Answer
Here are simplified financial statements for Phone Corporation in a recent year: INCOME STATEMENT (Figures in $ millions) Net sales $ 13,600 Cost of goods
Here are simplified financial statements for Phone Corporation in a recent year:
| INCOME STATEMENT | ||
| (Figures in $ millions) | ||
| Net sales | $ | 13,600 |
| Cost of goods sold | 4,310 | |
| Other expenses | 4,162 | |
| Depreciation | 2,668 | |
| Earnings before interest and taxes (EBIT) | $ | 2,460 |
| Interest expense | 710 | |
| Income before tax | $ | 1,750 |
| Taxes (at 30%) | 525 | |
| Net income | $ | 1,225 |
| Dividends | $ | 906 |
| BALANCE SHEET | |||||||
| (Figures in $ millions) | |||||||
| End of Year | Start of Year | ||||||
| Assets | |||||||
| Cash and marketable securities | $ | 94 | $ | 163 | |||
| Receivables | 2,632 | 2,590 | |||||
| Inventories | 212 | 263 | |||||
| Other current assets | 892 | 957 | |||||
| Total current assets | $ | 3,830 | $ | 3,973 | |||
| Net property, plant, and equipment | 20,023 | 19,965 | |||||
| Other long-term assets | 4,266 | 3,820 | |||||
| Total assets | $ | 28,119 | $ | 27,758 | |||
| Liabilities and shareholders equity | |||||||
| Payables | $ | 2,614 | $ | 3,090 | |||
| Short-term debt | 1,444 | 1,598 | |||||
| Other current liabilities | 836 | 812 | |||||
| Total current liabilities | $ | 4,894 | $ | 5,500 | |||
| Long-term debt and leases | 5,773 | 5,938 | |||||
| Other long-term liabilities | 6,228 | 6,199 | |||||
| Shareholders equity | 11,224 | 10,121 | |||||
| Total liabilities and shareholders equity | $ | 28,119 | $ | 27,758 | |||
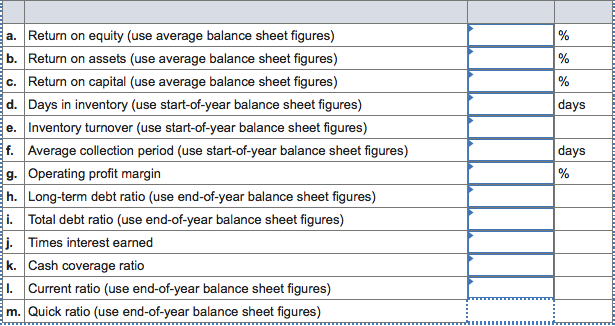
Calculate the following financial ratios for Phone Corporation: (Use 365 days in a year. Do not round intermediate calculations. Round your final answers to 2 decimal places.)

Step by Step Solution
There are 3 Steps involved in it
Step: 1

Get Instant Access to Expert-Tailored Solutions
See step-by-step solutions with expert insights and AI powered tools for academic success
Step: 2

Step: 3

Ace Your Homework with AI
Get the answers you need in no time with our AI-driven, step-by-step assistance
Get Started


