

Answered step by step
Verified Expert Solution
Question
1 Approved Answer
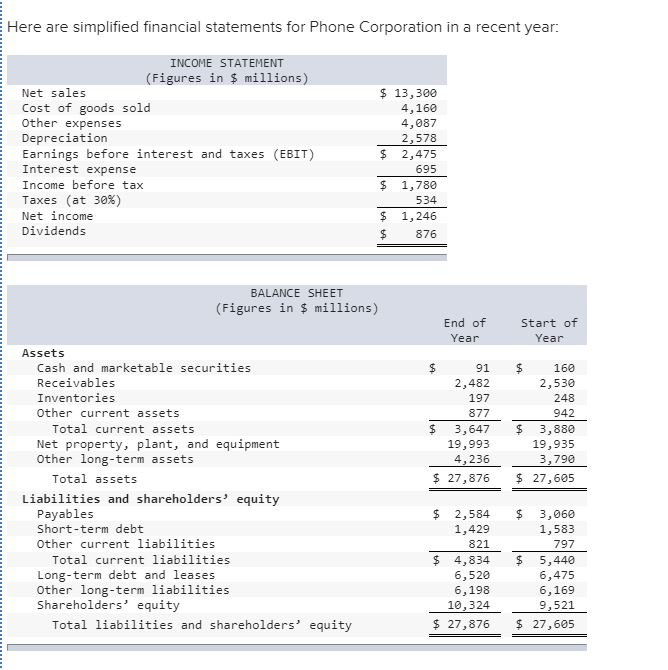
Here are simplified financial statements for Phone Corporation in a recent year: INCOME STATEMENT (Figures in $ millions) Net sales Cost of goods sold Other
Step by Step Solution
There are 3 Steps involved in it
Step: 1

Get Instant Access to Expert-Tailored Solutions
See step-by-step solutions with expert insights and AI powered tools for academic success
Step: 2

Step: 3
Ace Your Homework with AI
Get the answers you need in no time with our AI-driven, step-by-step assistance
Get Started
Public Finance In Theory And Practice
Authors: Richard Abel Musgrave, Peggy B. Muscrave
5th Edition
0070441278, 978-0070441279