

Answered step by step
Verified Expert Solution
Question
1 Approved Answer
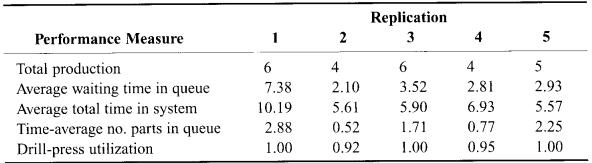
Here are the actual numbers used to plot the triangles for the double-time-arrival model in Figure 2-4 Replication hrfarmanee Measure 1 2 3 4 5
Here are the actual numbers used to plot the triangles for the double-time-arrival model in Figure 2-4
Step by Step Solution
There are 3 Steps involved in it
Step: 1

Get Instant Access to Expert-Tailored Solutions
See step-by-step solutions with expert insights and AI powered tools for academic success
Step: 2

Step: 3
Ace Your Homework with AI
Get the answers you need in no time with our AI-driven, step-by-step assistance
Get Started
Statistical Techniques in Business and Economics
Authors: Douglas A. Lind, William G Marchal
17th edition
1259666360, 978-1259666360