here are the screenshots of the question
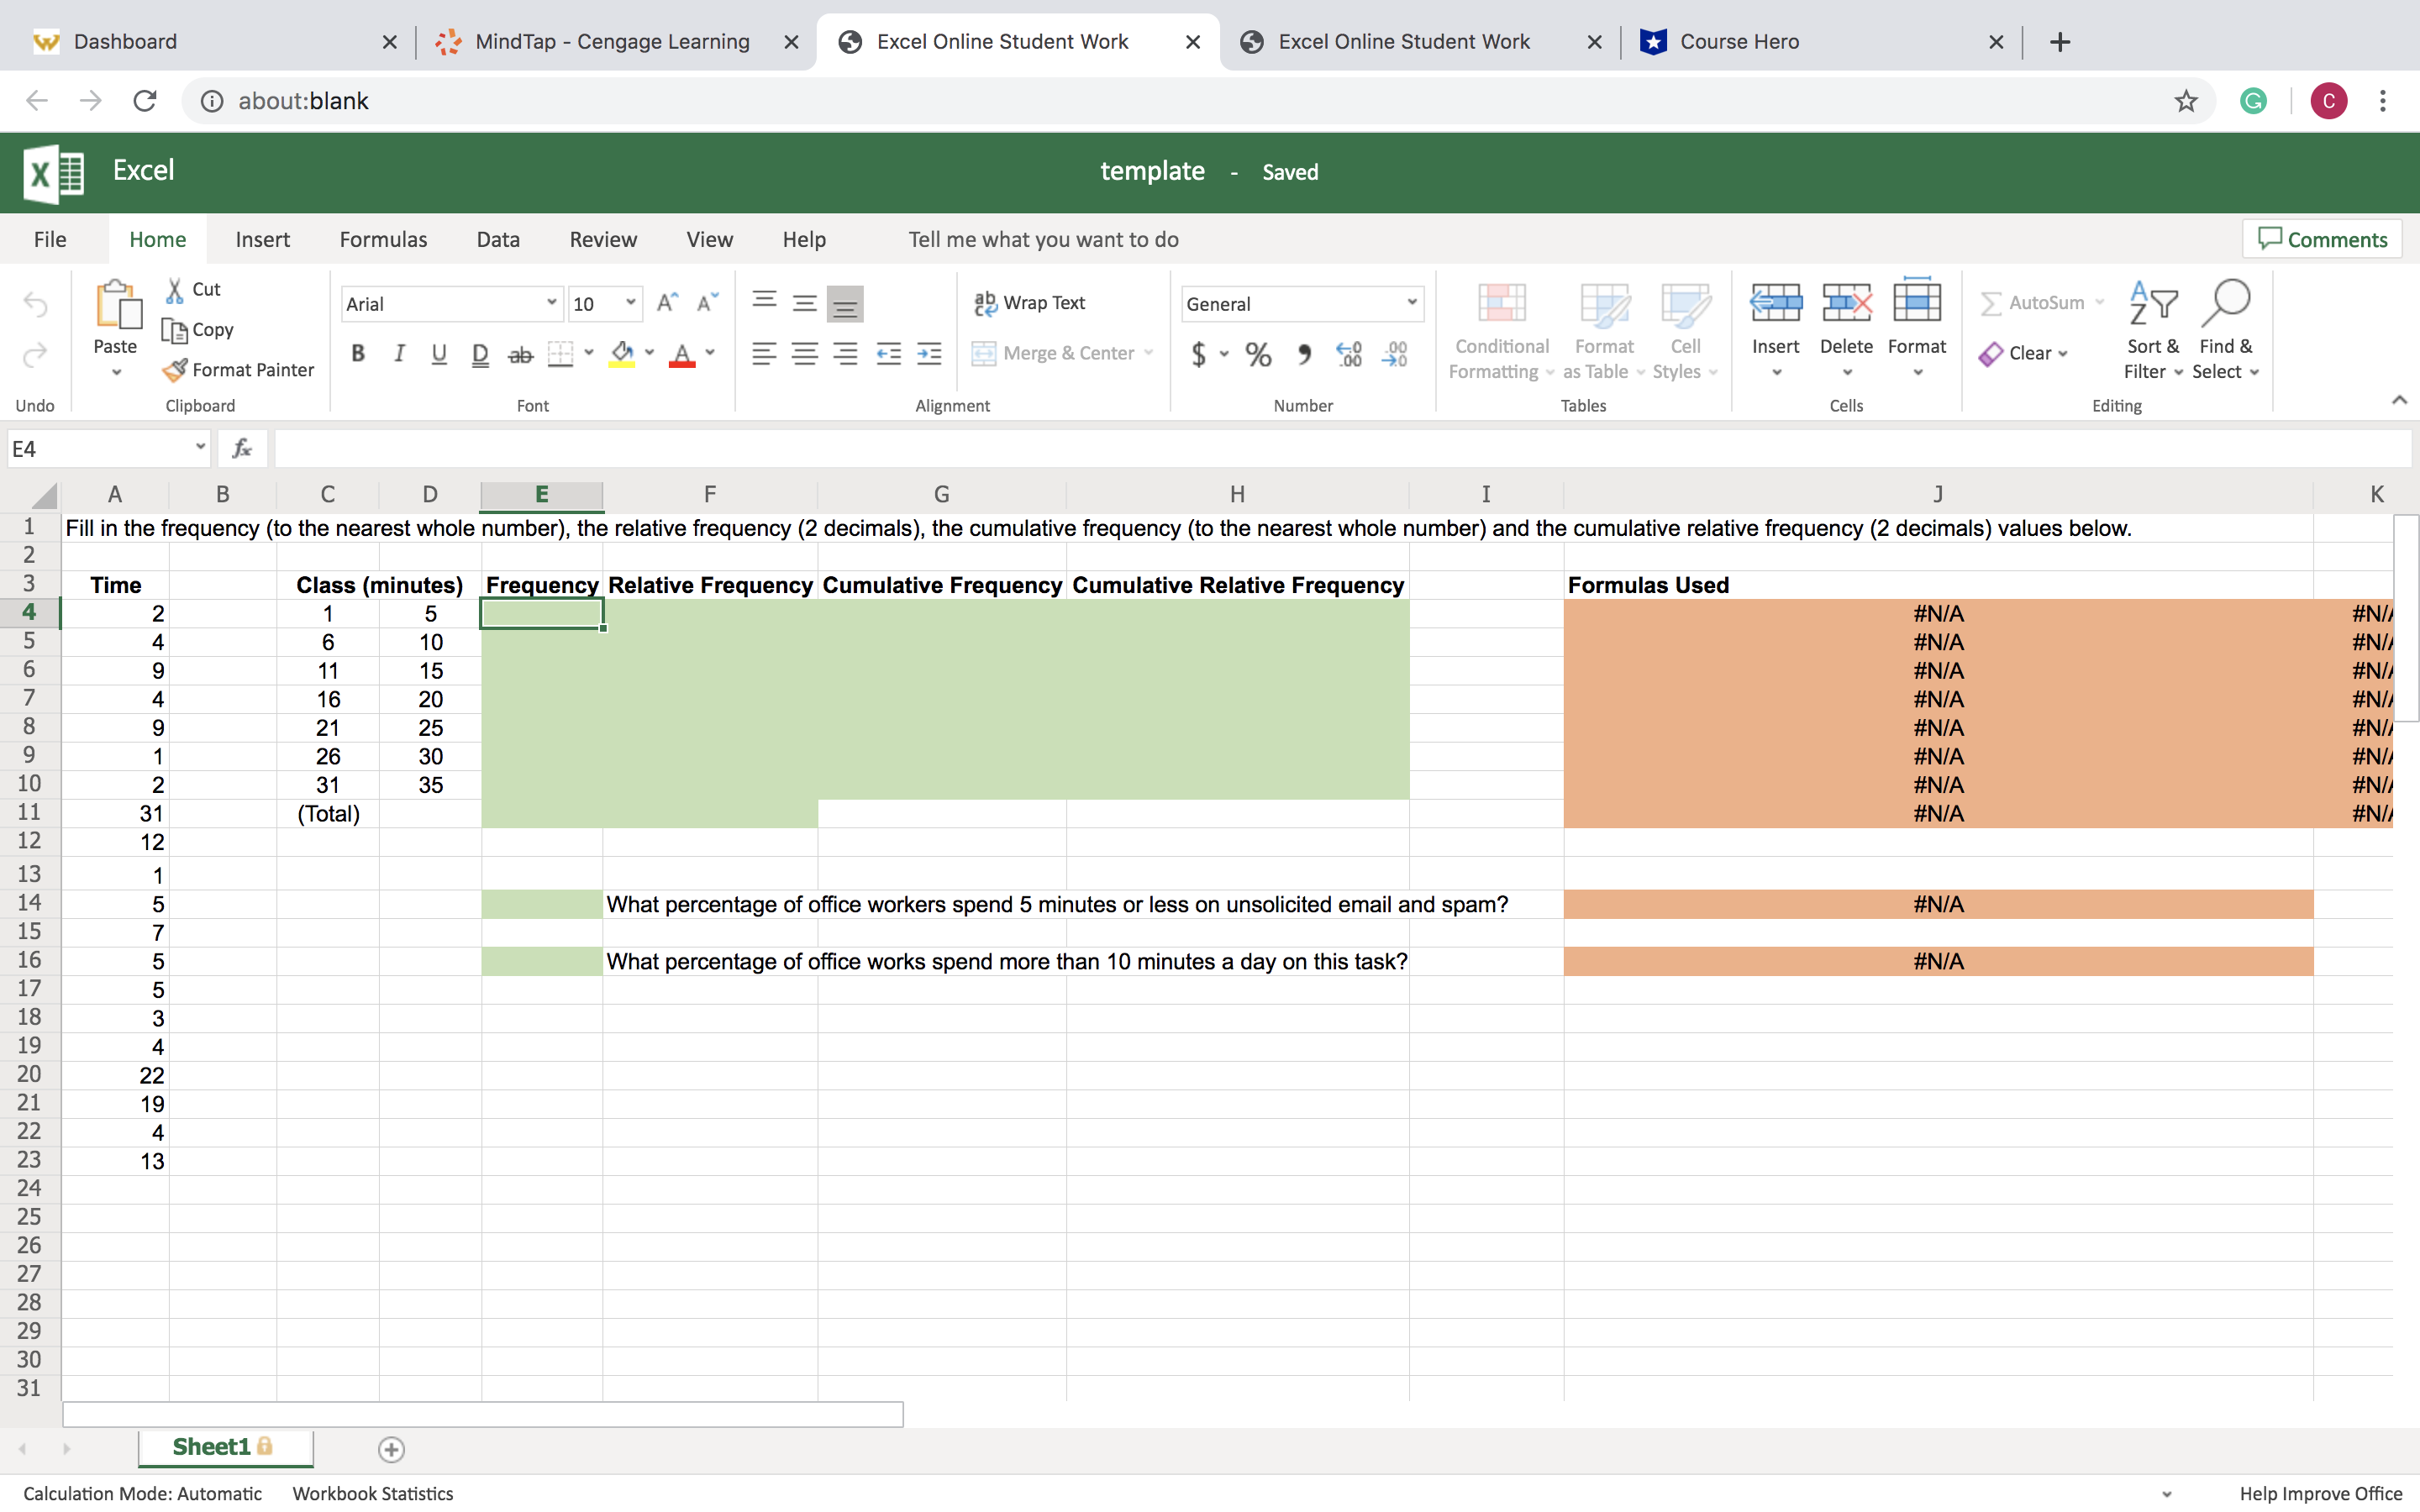
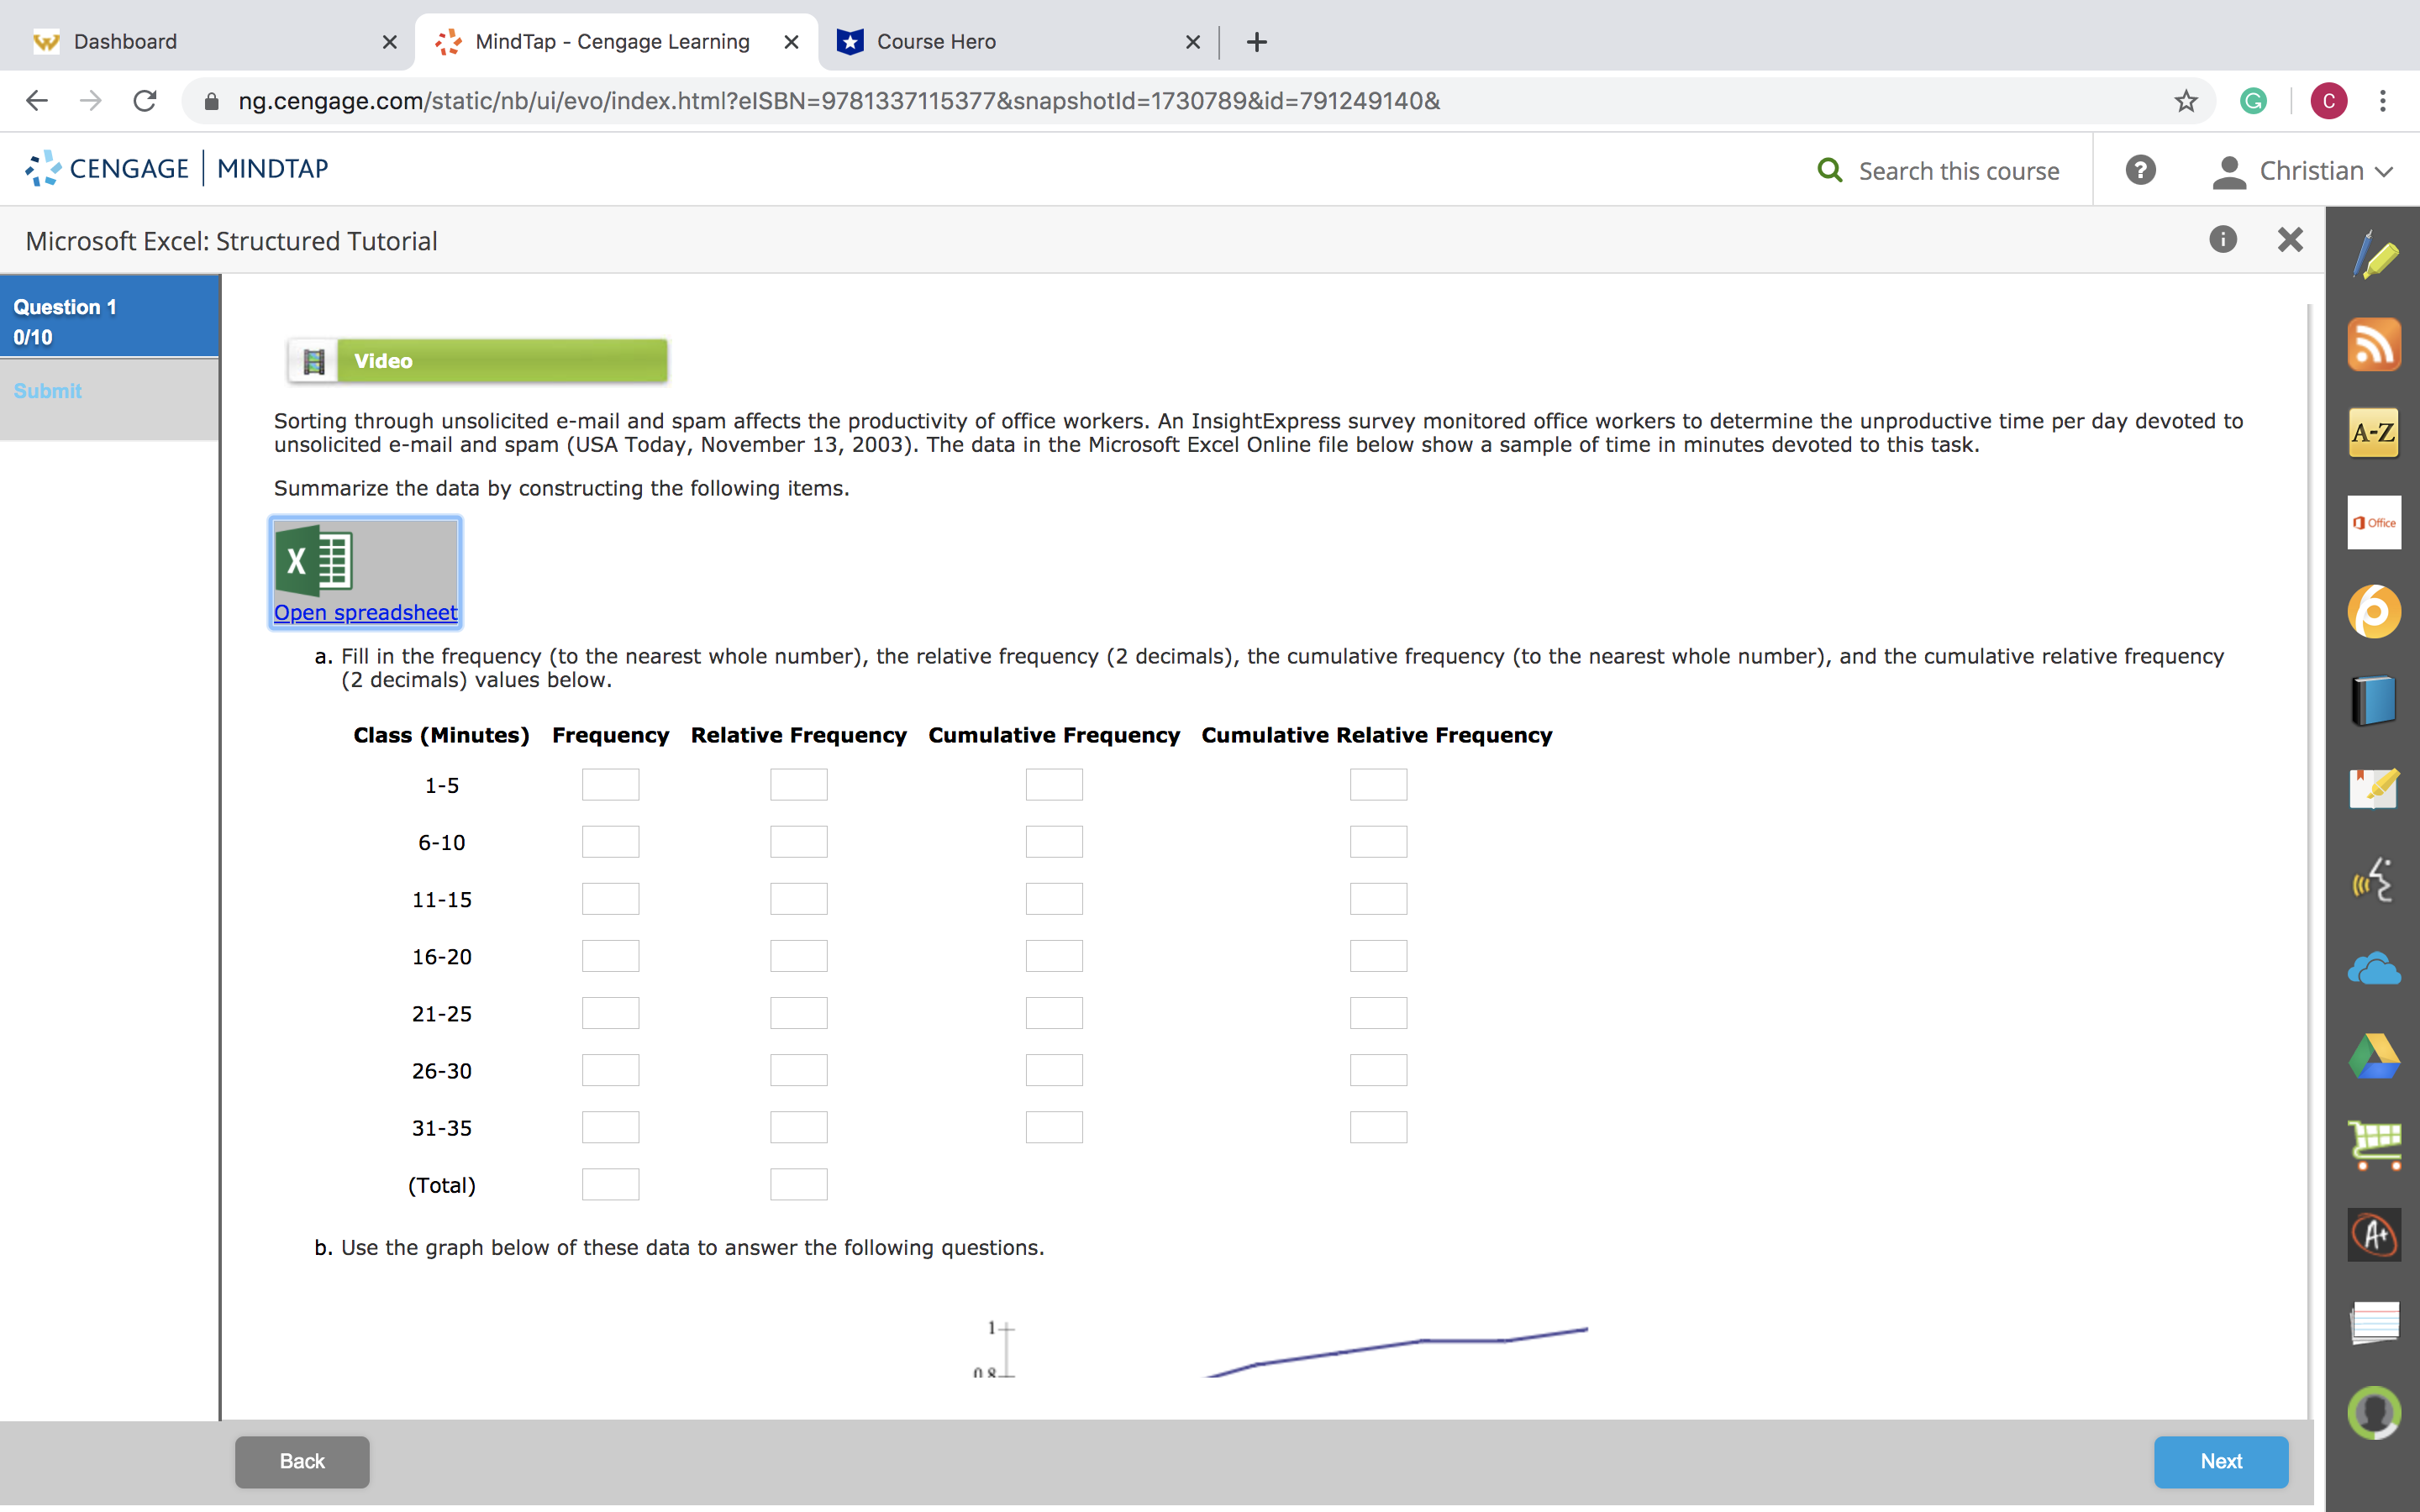
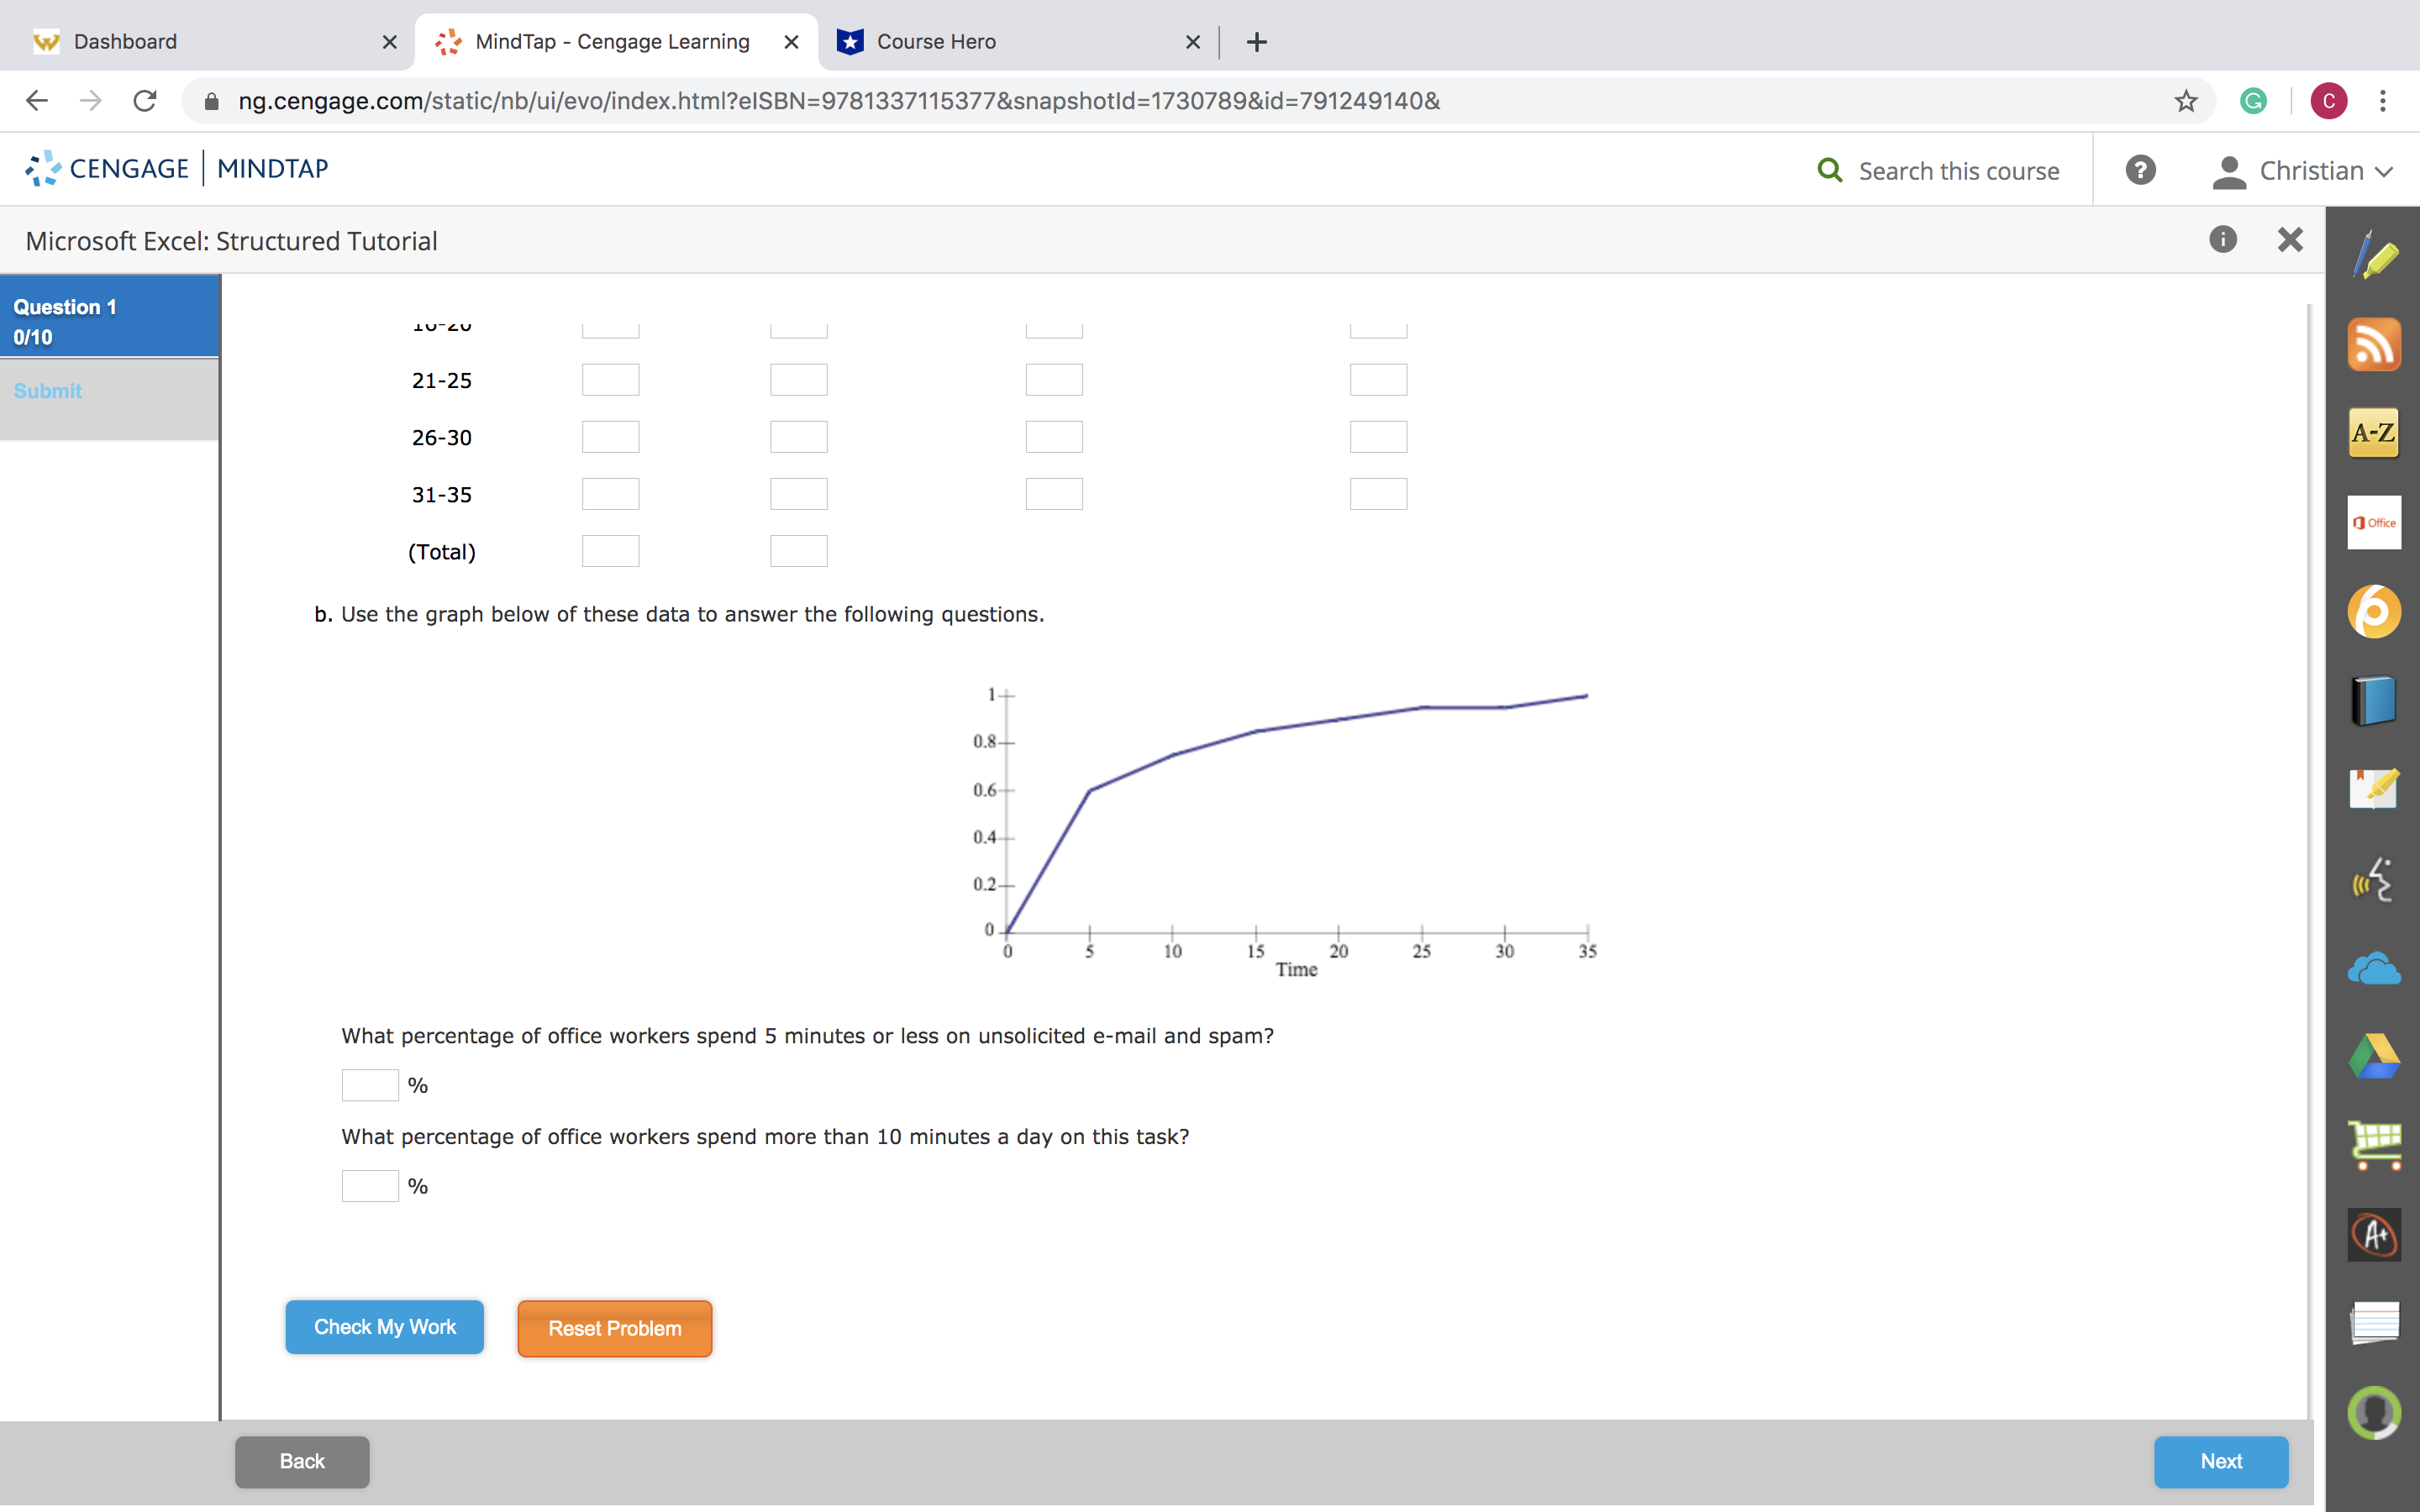
W Dashboard x MindTap - Cengage Learning X Excel Online Student Work X Excel Online Student Work Course Hero X + @ about:blank G C . .. X Excel template - Saved File Home Insert Formulas Data Review View Help Tell me what you want to do Comments X Cut Arial 10 E ap Wrap Text General AutoSum Paste [ Copy BIUDab Av Merge & Center $ ~ % 9 Conditional Format Cell Insert Delete Format Clear Sort & Find & Format Painter Formatting ~ as Table . Styles Filter . Select Undo Clipboard Font Alignment Number Tables Cells Editing F4 A B C D E F G H K Fill in the frequency (to the nearest whole number), the relative frequency (2 decimals), the cumulative frequency (to the nearest whole number) and the cumulative relative frequency (2 decimals) values below. Time Formulas Used WACONAW OI OI VOI - N - N - CO A CAN Class (minutes) Frequency Relative Frequency Cumulative Frequency Cumulative Relative Frequency 5 #N/A #N/ 10 IN/A #N/ 11 15 #N/A #N/ 16 20 #N/A #N/ 21 25 #N/A #NII 26 30 #N/A #N/ 31 35 #N/A #N/ (Total) #N/A #N/ What percentage of office workers spend 5 minutes or less on unsolicited email and spam? #N/A What percentage of office works spend more than 10 minutes a day on this task? #N/A Sheet1 0 + Calculation Mode: Automatic Workbook Statistics Help Improve OfficeW Dashboard X MindTap - Cengage Learning * *Course Hero X + C A ng.cengage.com/staticb/ui/evo/index.html?eISBN=9781337115377&snapshotld=1730789&id=791249140& G C CENGAGE | MINDTAP Q Search this course ? Christian v Microsoft Excel: Structured Tutorial X Question 1 0/10 H Video Submit Sorting through unsolicited e-mail and spam affects the productivity of office workers. An InsightExpress survey monitored office workers to determine the unproductive time per day devoted to unsolicited e-mail and spam (USA Today, November 13, 2003). The data in the Microsoft Excel Online file below show a sample of time in minutes devoted to this task. A-Z Summarize the data by constructing the following items. Office X Open spreadsheet a. Fill in the frequency (to the nearest whole number), the relative frequency (2 decimals), the cumulative frequency (to the nearest whole number), and the cumulative relative frequency (2 decimals) values below. Class (Minutes) Frequency Relative Frequency Cumulative Frequency Cumulative Relative Frequency 1-5 6-10 11-15 16-20 21-25 26-30 31-35 00 (Total) b. Use the graph below of these data to answer the following questions. A+ 1+ Back NextW Dashboard X MindTap - Cengage Learning * *Course Hero X + C A ng.cengage.com/staticb/ui/evo/index.html?eISBN=9781337115377&snapshotld=1730789&id=791249140& G C CENGAGE | MINDTAP Q Search this course ? Christian Microsoft Excel: Structured Tutorial X Question 1 0/10 LU-ZU Submit 21-25 26-30 31-35 (Total) 0000 A-Z ( Office b. Use the graph below of these data to answer the following questions. 1+ 0.8- 0.6- 0.4 0.2- 10 15 35 Time 20 25 30 What percentage of office workers spend 5 minutes or less on unsolicited e-mail and spam? % What percentage of office workers spend more than 10 minutes a day on this task? |% A+ Check My Work Reset Problem Back Next