Answered step by step
Verified Expert Solution
Question
1 Approved Answer
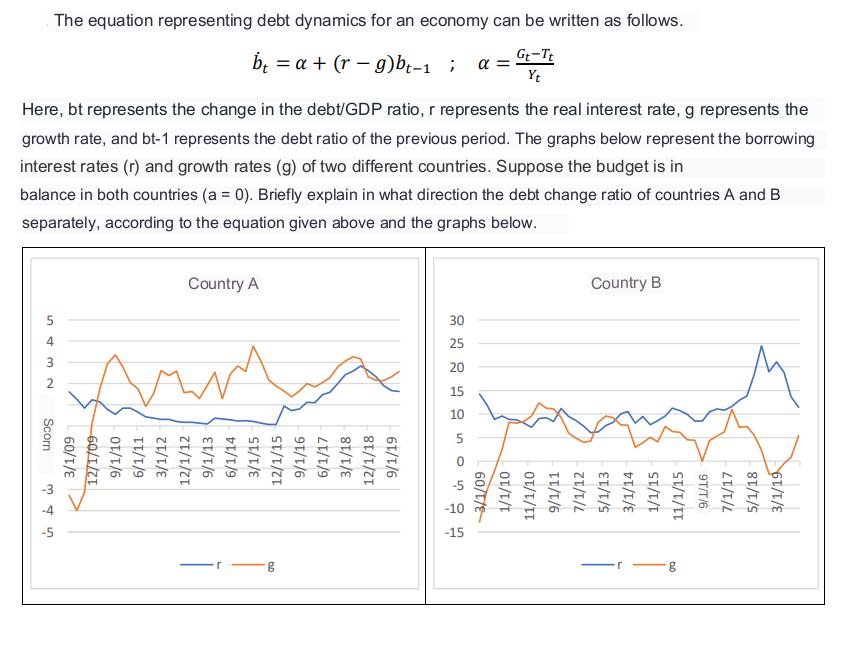
Here, bt represents the change in the debt/GDP ratio, r represents the real interest rate, g represents the growth rate, and bt-1 represents the

Here, bt represents the change in the debt/GDP ratio, r represents the real interest rate, g represents the growth rate, and bt-1 represents the debt ratio of the previous period. The graphs below represent the borrowing interest rates (r) and growth rates (g) of two different countries. Suppose the budget is in balance in both countries (a = 0). Briefly explain in what direction the debt change ratio of countries A and B separately, according to the equation given above and the graphs below. 5432 Scorn in bi The equation representing debt dynamics for an economy can be written as follows. b = a + (rg)bt-1 ; = Gt-Tt Yt 4 Amm 60/T/E 12/1/09- OT/T/6 TT/T/9 Country A 3/1/12 12/1/12 9/1/13 6/1/14 3/1/15 12/1/15 g 91/1/6 LT/T/9 3/1/18 12/1/18 9/1/19 30 25 20 15 10 -5 -10 -15 60/1/E Country B 1/1/10 11/1/10 9/1/11 7/1/12 5/1/13 3/1/14 1/1/15 11/1/15 g 9T/T/6 7/1/17 5/1/18 3/1/19
Step by Step Solution
There are 3 Steps involved in it
Step: 1

Get Instant Access to Expert-Tailored Solutions
See step-by-step solutions with expert insights and AI powered tools for academic success
Step: 2

Step: 3

Ace Your Homework with AI
Get the answers you need in no time with our AI-driven, step-by-step assistance
Get Started


