

Answered step by step
Verified Expert Solution
Question
1 Approved Answer
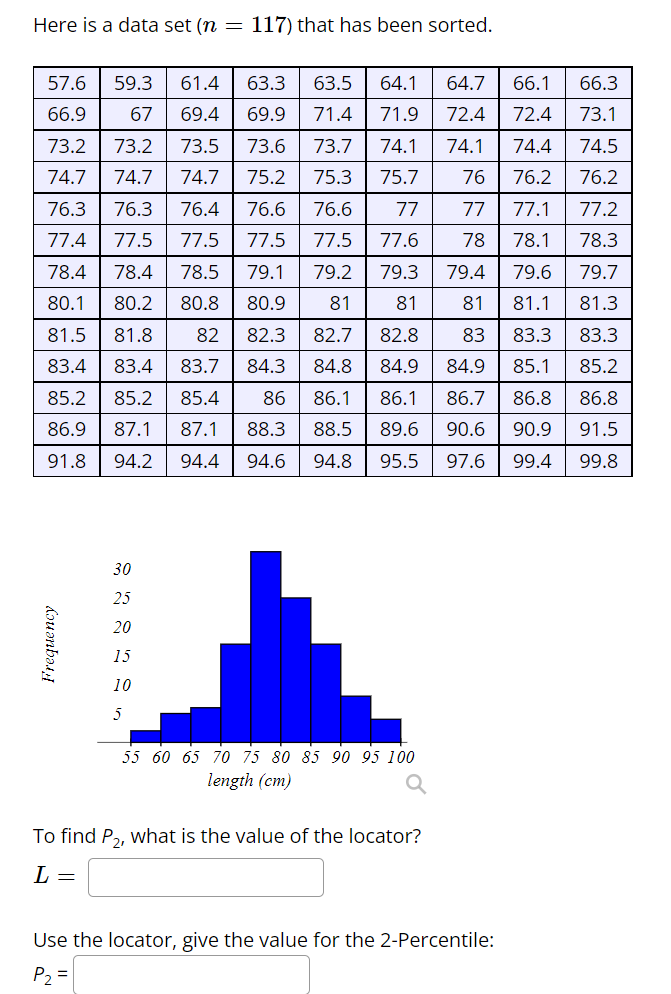
Here is a data set (n = 117) that has been sorted. 57.6 59.3 61.4 63.3 63.5 64.1 64.7 66.1 66.3 66.9 67 69.4 69.9


Step by Step Solution
There are 3 Steps involved in it
Step: 1

Get Instant Access to Expert-Tailored Solutions
See step-by-step solutions with expert insights and AI powered tools for academic success
Step: 2

Step: 3
Ace Your Homework with AI
Get the answers you need in no time with our AI-driven, step-by-step assistance
Get Started
Elementary Theory Of Numbers
Authors: William J LeVeque
1st Edition
0486150763, 9780486150765