

Answered step by step
Verified Expert Solution
Question
1 Approved Answer
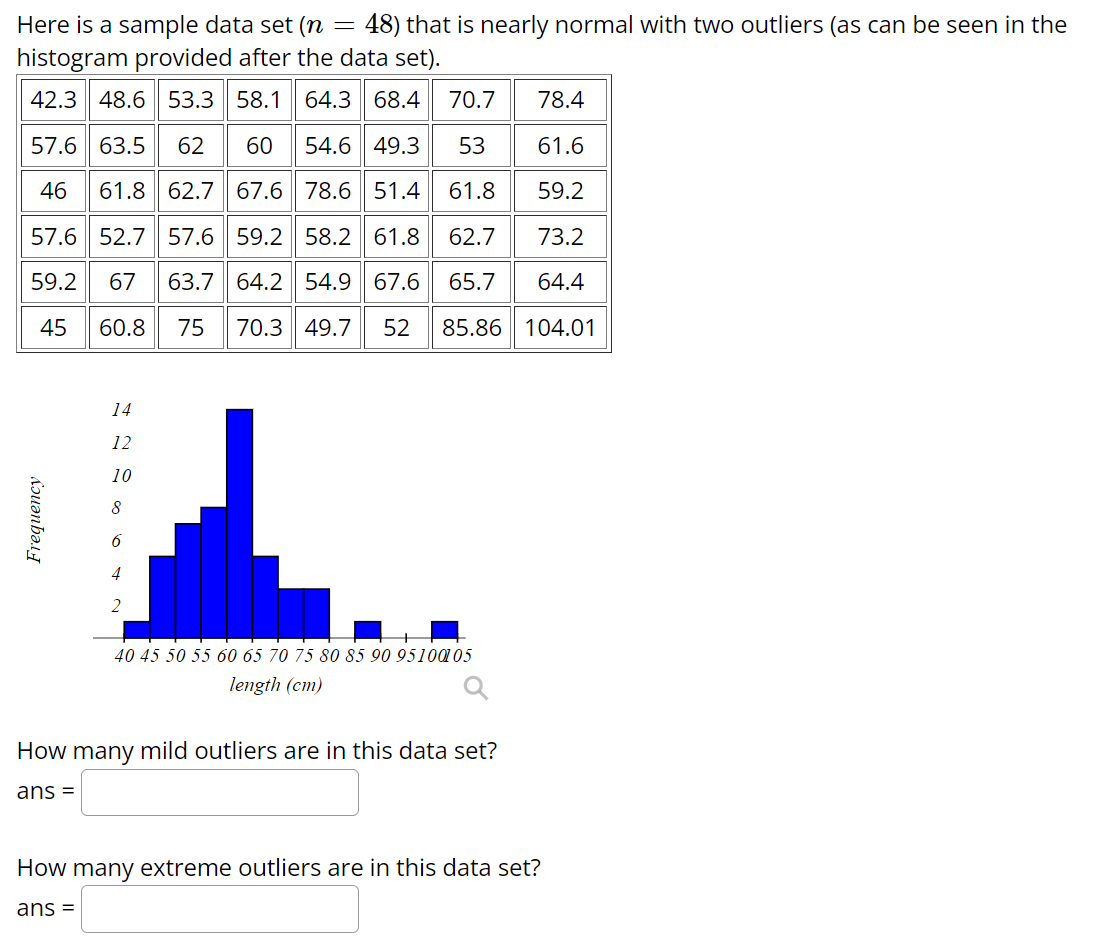
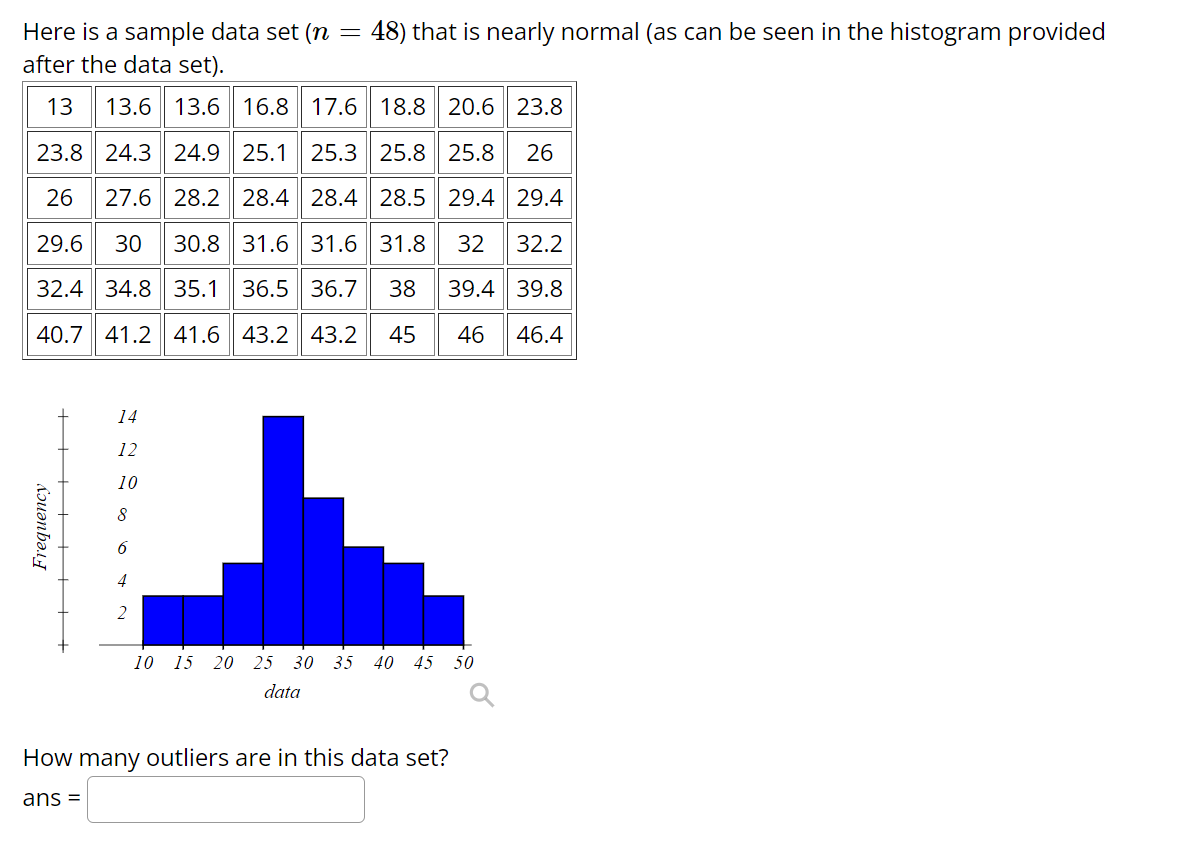
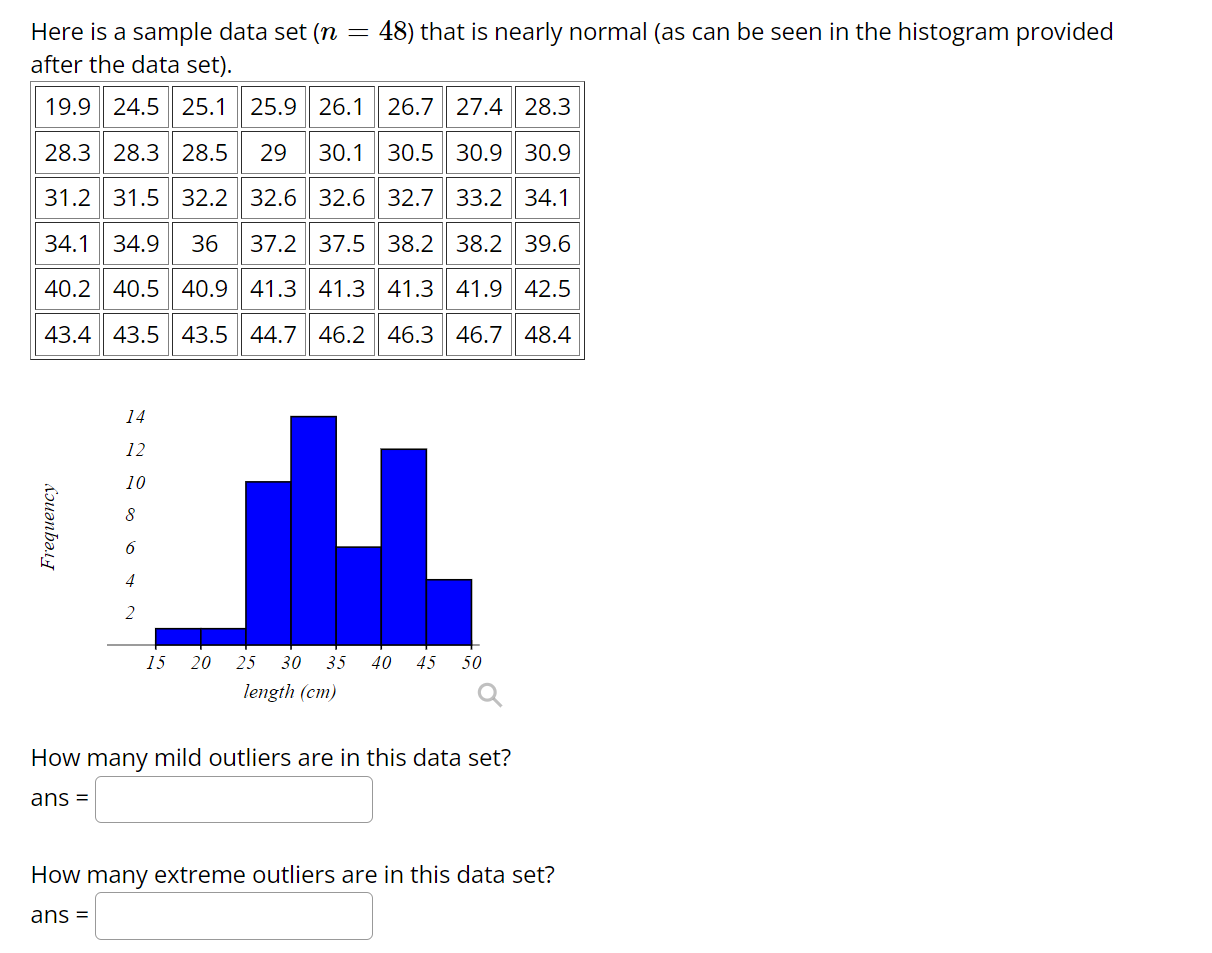
Here is a sample data set (n = 48) that is nearly normal with two outliers (as can be seen in the histogram provided after
Step by Step Solution
There are 3 Steps involved in it
Step: 1

Get Instant Access to Expert-Tailored Solutions
See step-by-step solutions with expert insights and AI powered tools for academic success
Step: 2

Step: 3
Ace Your Homework with AI
Get the answers you need in no time with our AI-driven, step-by-step assistance
Get Started
A First Course In Differential Equations With Modeling Applications
Authors: Dennis G Zill
11th Edition
1337515574, 9781337515573