

Question
Here is the assignment for my finance class. I know it is a lot and I am not asking for all the answers, but could
Here is the assignment for my finance class. I know it is a lot and I am not asking for all the answers, but could you please show me how to approach this problem. I am completely lost.
Please complete all the ratios on the "Ratio Chart - Chapter 4" from the Balance Sheet and Income Statement for a company called JR Wholesaling.
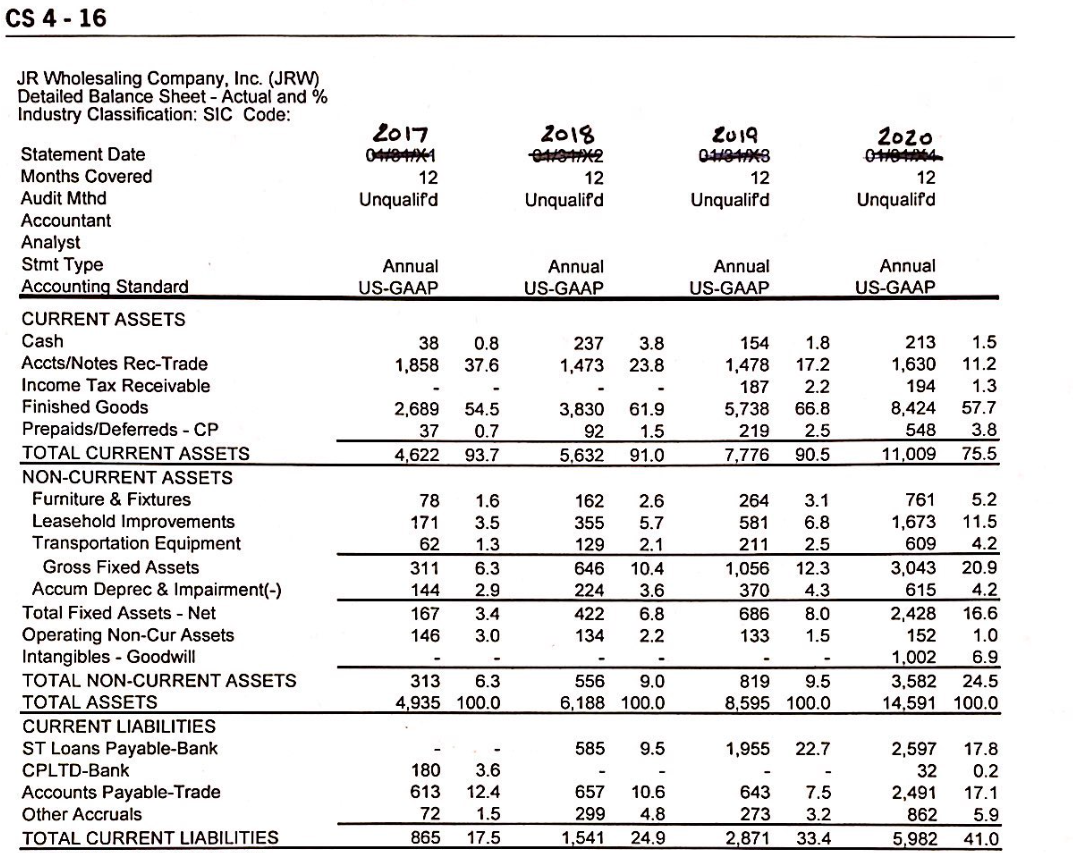
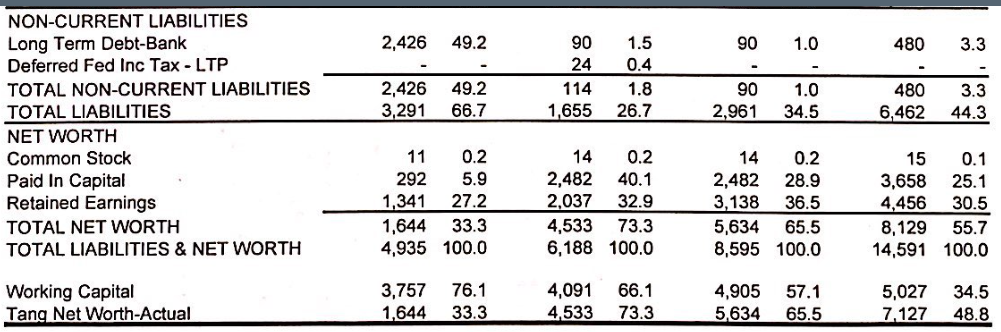
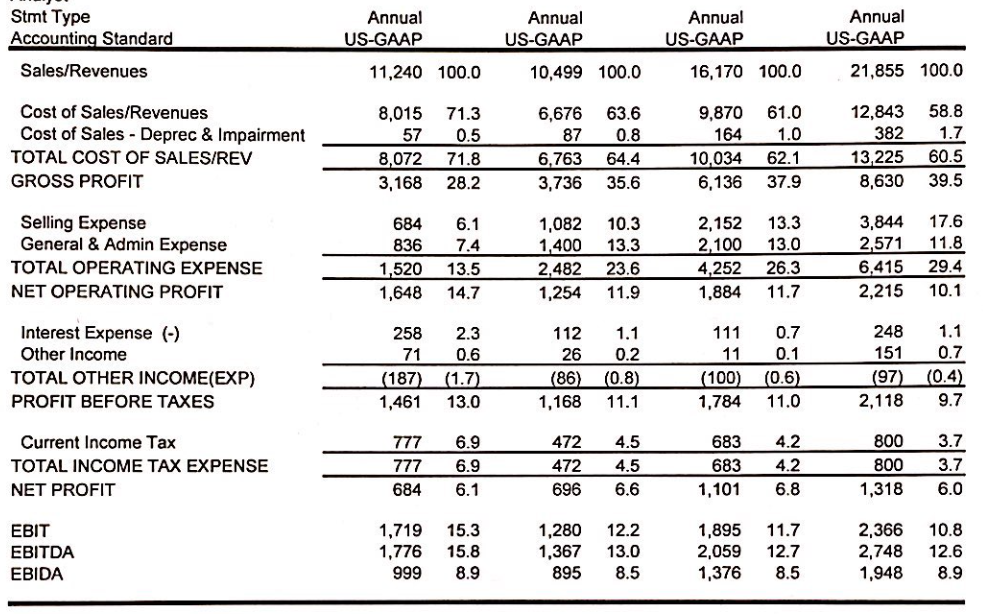
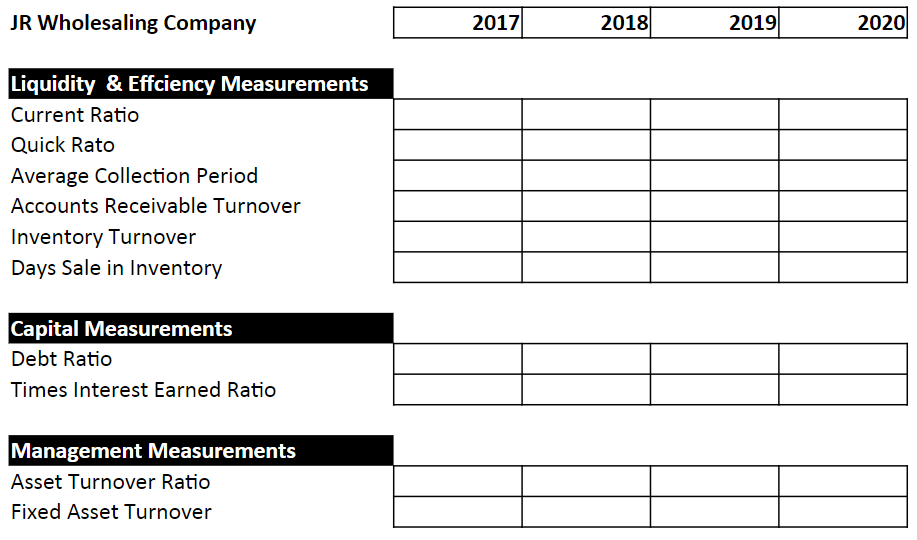
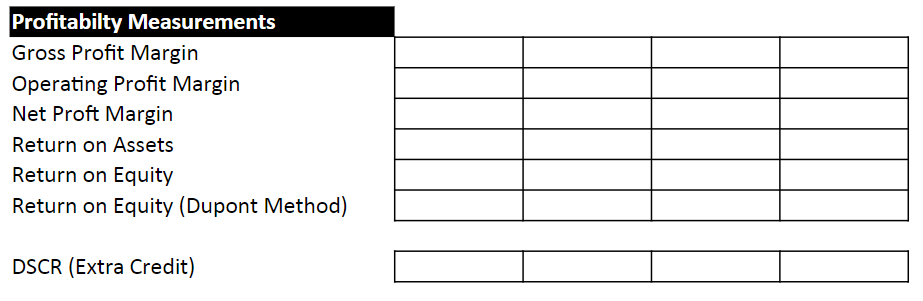
CS 4-16 JR Wholesaling Company, Inc. (JRW) Detailed Balance Sheet - Actual and % Industry Classification: SIC Code: 2017 0410411441 12 Unqualifd 2018 11X2 12 Unqualifd 2019 0.118413 12 Unqualifd 2020 01064 12 Unqualifd Statement Date Months Covered Audit Mthd Accountant Analyst Stmt Type Accounting Standard Annual US-GAAP Annual US-GAAP Annual US-GAAP Annual US-GAAP 38 1,858 0.8 37.6 237 1,473 3.8 23.8 1.8 17.2 2.2 66.8 2.5 90.5 154 1,478 187 5,738 219 7,776 213 1,630 194 8,424 548 11,009 1.5 11.2 1.3 57.7 3.8 75.5 2,689 37 4,622 54.5 0.7 93.7 3,830 92 5,632 61.9 1.5 91.0 CURRENT ASSETS Cash Accts/Notes Rec-Trade Income Tax Receivable Finished Goods Prepaids/Deferreds - CP TOTAL CURRENT ASSETS NON-CURRENT ASSETS Furniture & Fixtures Leasehold Improvements Transportation Equipment Gross Fixed Assets Accum Deprec & Impairment(-) Total Fixed Assets - Net Operating Non-Cur Assets Intangibles - Goodwill TOTAL NON-CURRENT ASSETS TOTAL ASSETS CURRENT LIABILITIES ST Loans Payable-Bank CPLTD-Bank Accounts Payable-Trade Other Accruals TOTAL CURRENT LIABILITIES 78 171 62 311 144 167 146 1.6 3.5 1.3 6.3 2.9 3.4 3.0 162 355 129 646 224 422 134 2.6 5.7 2.1 10.4 3.6 6.8 2.2 264 581 211 1,056 370 686 133 3.1 6.8 2.5 12.3 4.3 8.0 1.5 761 5.2 1,673 11.5 609 4.2 3,043 20.9 615 4.2 2,428 16.6 152 1.0 1,002 6.9 3,582 24.5 14,591 100.0 0- . 313 6.3 4,935 100.0 556 9.0 6,188 100.0 819 9.5 8,595 100.0 585 9.5 1,955 22.7 180 613 72 865 3.6 12.4 1.5 17.5 657 299 1,541 10.6 4.8 24.9 643 273 2,871 www 7.5 3.2 33.4 2,597 32 2,491 862 5,982 17.8 0.2 17.1 5.9 41.0 2,426 49.2 90 1.0 480 3.3 2,426 3,291 90 24 114 1,655 1.5 0.4 1.8 26.7 49.2 66.7 90 2,961 1.0 34.5 480 6,462 3.3 44.3 NON-CURRENT LIABILITIES Long Term Debt-Bank Deferred Fed Inc Tax - LTP TOTAL NON-CURRENT LIABILITIES TOTAL LIABILITIES NET WORTH Common Stock Paid In Capital Retained Earnings TOTAL NET WORTH TOTAL LIABILITIES & NET WORTH 11 0.2 292 5.9 1,341 27.2 1,644 33.3 4,935 100.0 14 0.2 2,482 40.1 2,037 32.9 4,533 73.3 6,188 100.0 14 0.2 2,482 28.9 3,138 36.5 5,634 65.5 8,595 100.0 15 0.1 3,658 25.1 4,456 30.5 8,129 55.7 14,591 100.0 Working Capital Tang Net Worth-Actual 3,757 1,644 76.1 33.3 4,091 4,533 66.1 73.3 4,905 5,634 57.1 65.5 5,027 7,127 34.5 48.8 CS 4 - 15 JR Wholesaling Company, Inc. (JRW) Detailed Income Statement - Actual and % Industry Classification: SIC Code: 2017 2018 20 20 2019 0419 12 Unqualifd 12 Unqualifd 12 Unqualifd 12 Unqualifd Statement Date Months Covered Audit Mthd Accountant Analyst Stmt Type Accounting Standard Annual US-GAAP Annual US-GAAP Annual US-GAAP Annual US-GAAP Stmt Type Accounting Standard Annual US-GAAP Annual US-GAAP Annual US-GAAP Annual US-GAAP Sales/Revenues 11,240 100.0 10,499 100.0 16,170 100.0 21,855 100.0 63.6 Cost of Sales/Revenues Cost of Sales - Deprec & Impairment TOTAL COST OF SALES/REV GROSS PROFIT 8,015 57 8,072 3,168 71.3 0.5 71.8 28.2 6,676 87 6,763 3,736 0.8 64.4 35.6 9,870 164 10,034 6,136 61.0 1.0 62.1 37.9 12,843 382 13,225 8,630 58.8 1.7 60.5 39.5 Selling Expense General & Admin Expense TOTAL OPERATING EXPENSE NET OPERATING PROFIT 684 836 1,520 1,648 6.1 7.4 13.5 14.7 1,082 1,400 2,482 1,254 10.3 13.3 23.6 11.9 2,152 2,100 4,252 1,884 13.3 13.0 26.3 11.7 3,844 2,571 6,415 2,215 17.6 11.8 29.4 10.1 Interest Expense (-) Other Income TOTAL OTHER INCOME(EXP) PROFIT BEFORE TAXES 258 71 (187) 1,461 2.3 0.6 (1.7) 13.0 112 26 (86) 1,168 1.1 0.2 (0.8) 11.1 111 11 (100) 1,784 0.7 0.1 (0.6) 11.0 248 151 (97) 2,118 1.1 0.7 (0.4) 9.7 Current Income Tax TOTAL INCOME TAX EXPENSE NET PROFIT 777 777 684 6.9 6.9 6.1 472 472 696 4.5 4.5 6.6 683 683 1,101 4.2 4.2 6.8 800 800 1,318 3.7 3.7 6.0 EBIT EBITDA EBIDA 1,719 1,776 15.3 15.8 8.9 1,280 1,367 12.2 13.0 8.5 1,895 2,059 1,376 11.7 12.7 8.5 2,366 2,748 1,948 10.8 12.6 8.9 999 895 JR Wholesaling Company 2017 2018 2019 2020 Liquidity & Effciency Measurements Current Ratio Quick Rato Average Collection Period Accounts Receivable Turnover Inventory Turnover Days Sale in Inventory Capital Measurements Debt Ratio Times Interest Earned Ratio Management Measurements Asset Turnover Ratio Fixed Asset Turnover Profitabilty Measurements Gross Profit Margin Operating Profit Margin Net Proft Margin Return on Assets Return on Equity Return on Equity (Dupont Method) DSCR (Extra Credit)
Step by Step Solution
There are 3 Steps involved in it
Step: 1

Get Instant Access to Expert-Tailored Solutions
See step-by-step solutions with expert insights and AI powered tools for academic success
Step: 2

Step: 3
Ace Your Homework with AI
Get the answers you need in no time with our AI-driven, step-by-step assistance
Get Started
Multifractal Financial Markets An Alternative Approach To Asset And Risk Management
Authors: Yasmine Hayek Kobeissi
1st Edition
1461444896, 978-1461444893