

Question
Here is the code below I want this code represent the frequency domain as showing above by applying rectangular widow. However, the rectangular length going
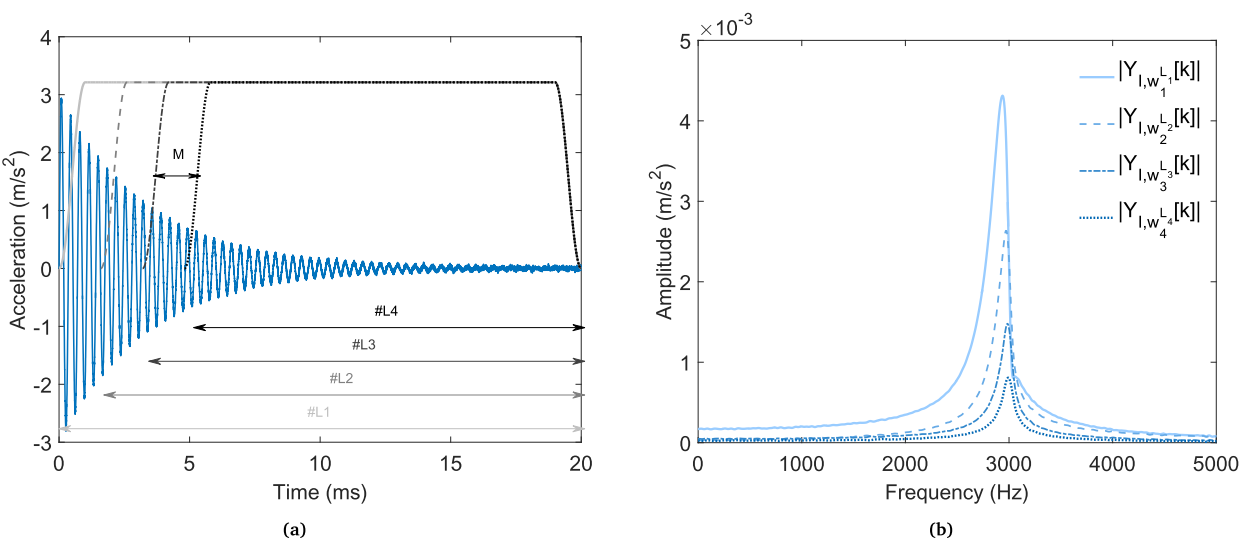
Here is the code below I want this code represent the frequency domain as showing above by applying rectangular widow. However, the rectangular length going to be 0.2*signal shifting from the right to the left 5 times
N= 10000
L= 2000
So the we take the first 2000 element of T (0:2000) and (2000:4000) and so on
Code:-
clc
clear all;
close all;
fs=100000;%sampling frequency, N=1/2deltaT, deltaT step in T
N= 100000;
t = (0:1/fs:(10-(1/fs)));
f= 1000;
alpha= (f*pi)/5000;
theta= 30;
y = 100*exp(-alpha*t).*sin(2*pi*f*t+ theta);
figure(1)
plot(t,y); grid on
%%---
%FFT1
N1=fs;
S =fft(y,N1);
F1=S(1:N1/2); %half of spectra
PF1=2*F1.*conj(F1)/(fs*N1); %Power spectrum density per 1 kHz
E=sum(PF1);%energy of signal V^2*T
Xdb = 20*log10(S);
LPF1=10*log10(PF1); %Power spectrum in dB scale
LP=LPF1(1:N1/2);
fvec=fs*(1:N1/2)/N1; % frequency array
%-------
w2= 0.2*N:0.4*N;
x2 = rectwin(length(w2));
%len=0.2*N:N-1
yshort2= y(w2);
u2= x2'.*(yshort2-1);
t2 = 1/fs*(0:length(yshort2)-1);
figure
plot(t2,u2)
grid on
%%FFT
N2=0.2*N1;
S2 =fft(u2,N2);
F2=S(1:N1/2); %half of spectra
PF2=2*F2.*conj(F2)/(fs*N2); %Power spectrum density per 1 kHz
E2=sum(PF2);%energy of signal V^2*T
Xdb2 = 20*log10(S2);
LPF2=10*log10(PF2); %Power spectrum in dB scale
LP2=LPF2(1:N1/2);
fvec2=fs*(1:N1/2)/N1; % frequency array
%-------
w3= 0.4*N:0.6*N;
x3 = rectwin(length(w3));
yshort3= y(w3);
u3= x3'.*(yshort3-1);
t3 = 1/fs*(0:length(yshort3)-1);
figure
plot(t3,u3)
grid on
%FFT3
N3=0.2*N1;
S3 =fft(u3,N3);
F3=S(1:N1/2); %half of spectra
PF3=2*F3.*conj(F3)/(fs*N3); %Power spectrum density per 1 kHz
E3=sum(PF3);%energy of signal V^2*T
Xdb3 = 20*log10(S3);
LPF3=10*log10(PF3); %Power spectrum in dB scale
LP3=LPF3(1:N1/2);
fvec3=fs*(1:N1/2)/N1; % frequency array
%-------
w4= 0.6*N:0.8*N;
x4 = boxcar(length(w4));
yshort4 = y(w4);
u4= x4'.*yshort4;
t4 = 1/fs*(0:length(yshort4)-1);
figure
plot(t4,u4)
grid on
%FFT4
N4=0.2*N1;
S4 =fft(u4,N4);
F4=S(1:N1/2); %half of spectra
PF4=2*F4.*conj(F4)/(fs*N4); %Power spectrum density per 1 kHz
E4=sum(PF4);%energy of signal V^2*T
Xdb4 = 20*log10(S4);
LPF4=10*log10(PF4); %Power spectrum in dB scale
LP4=LPF4(1:N1/2);
fvec4=fs*(1:N1/2)/N1; % frequency array
%-------
w5= 0.8*N:N-1;
x5 = boxcar(length(w5));
yshort5= y(w5);
u5= x5'.*yshort5;
t5 = 1/fs*(0:length(yshort5)-1);
figure
plot(t5,u5)
grid on
%%FFT5
N5=0.2*N1;
S5 =fft(u5,N5);
F5=S(1:N1/2); %half of spectra
PF5=2*F5.*conj(F5)/(fs*N5); %Power spectrum density per 1 kHz
E5=sum(PF5);%energy of signal V^2*T
Xdb5 = 20*log10(S5);
LPF5=10*log10(PF5); %Power spectrum in dB scale
LP5=LPF5(1:N1/2);
fvec5=fs*(1:N1/2)/N1; % frequency array
figure
plot(fvec,LP)
hold on
plot(fvec2, LP2)
hold on
plot(fvec3,LP3)
hold on
plot(fvec4,LP4)
hold on
plot(fvec5,LP5)
hold off
Someone please fix this code asap...
4 5 103 JY 17,,, [k]] 3 4. -VY,w_2[k]] M -...[k] ...IY - [k] Acceleration (m/s) Amplitude (m/s2) mmmm #L4 #L3 1 -2 #L2 #L1 -3 0 0 0 5 15 20 1000 4000 5000 10 Time (ms) 2000 3000 Frequency (Hz) (b) (a) 4 5 103 JY 17,,, [k]] 3 4. -VY,w_2[k]] M -...[k] ...IY - [k] Acceleration (m/s) Amplitude (m/s2) mmmm #L4 #L3 1 -2 #L2 #L1 -3 0 0 0 5 15 20 1000 4000 5000 10 Time (ms) 2000 3000 Frequency (Hz) (b) (a)Step by Step Solution
There are 3 Steps involved in it
Step: 1

Get Instant Access to Expert-Tailored Solutions
See step-by-step solutions with expert insights and AI powered tools for academic success
Step: 2

Step: 3
Ace Your Homework with AI
Get the answers you need in no time with our AI-driven, step-by-step assistance
Get Started
Databases And Python Programming MySQL MongoDB OOP And Tkinter
Authors: R. PANNEERSELVAM
1st Edition
9357011331, 978-9357011334