

Answered step by step
Verified Expert Solution
Question
1 Approved Answer
HERE IS WHAT I WANT YOU TO DO: Your assigned task is to create the best ordinary least squares linear regression model you can using
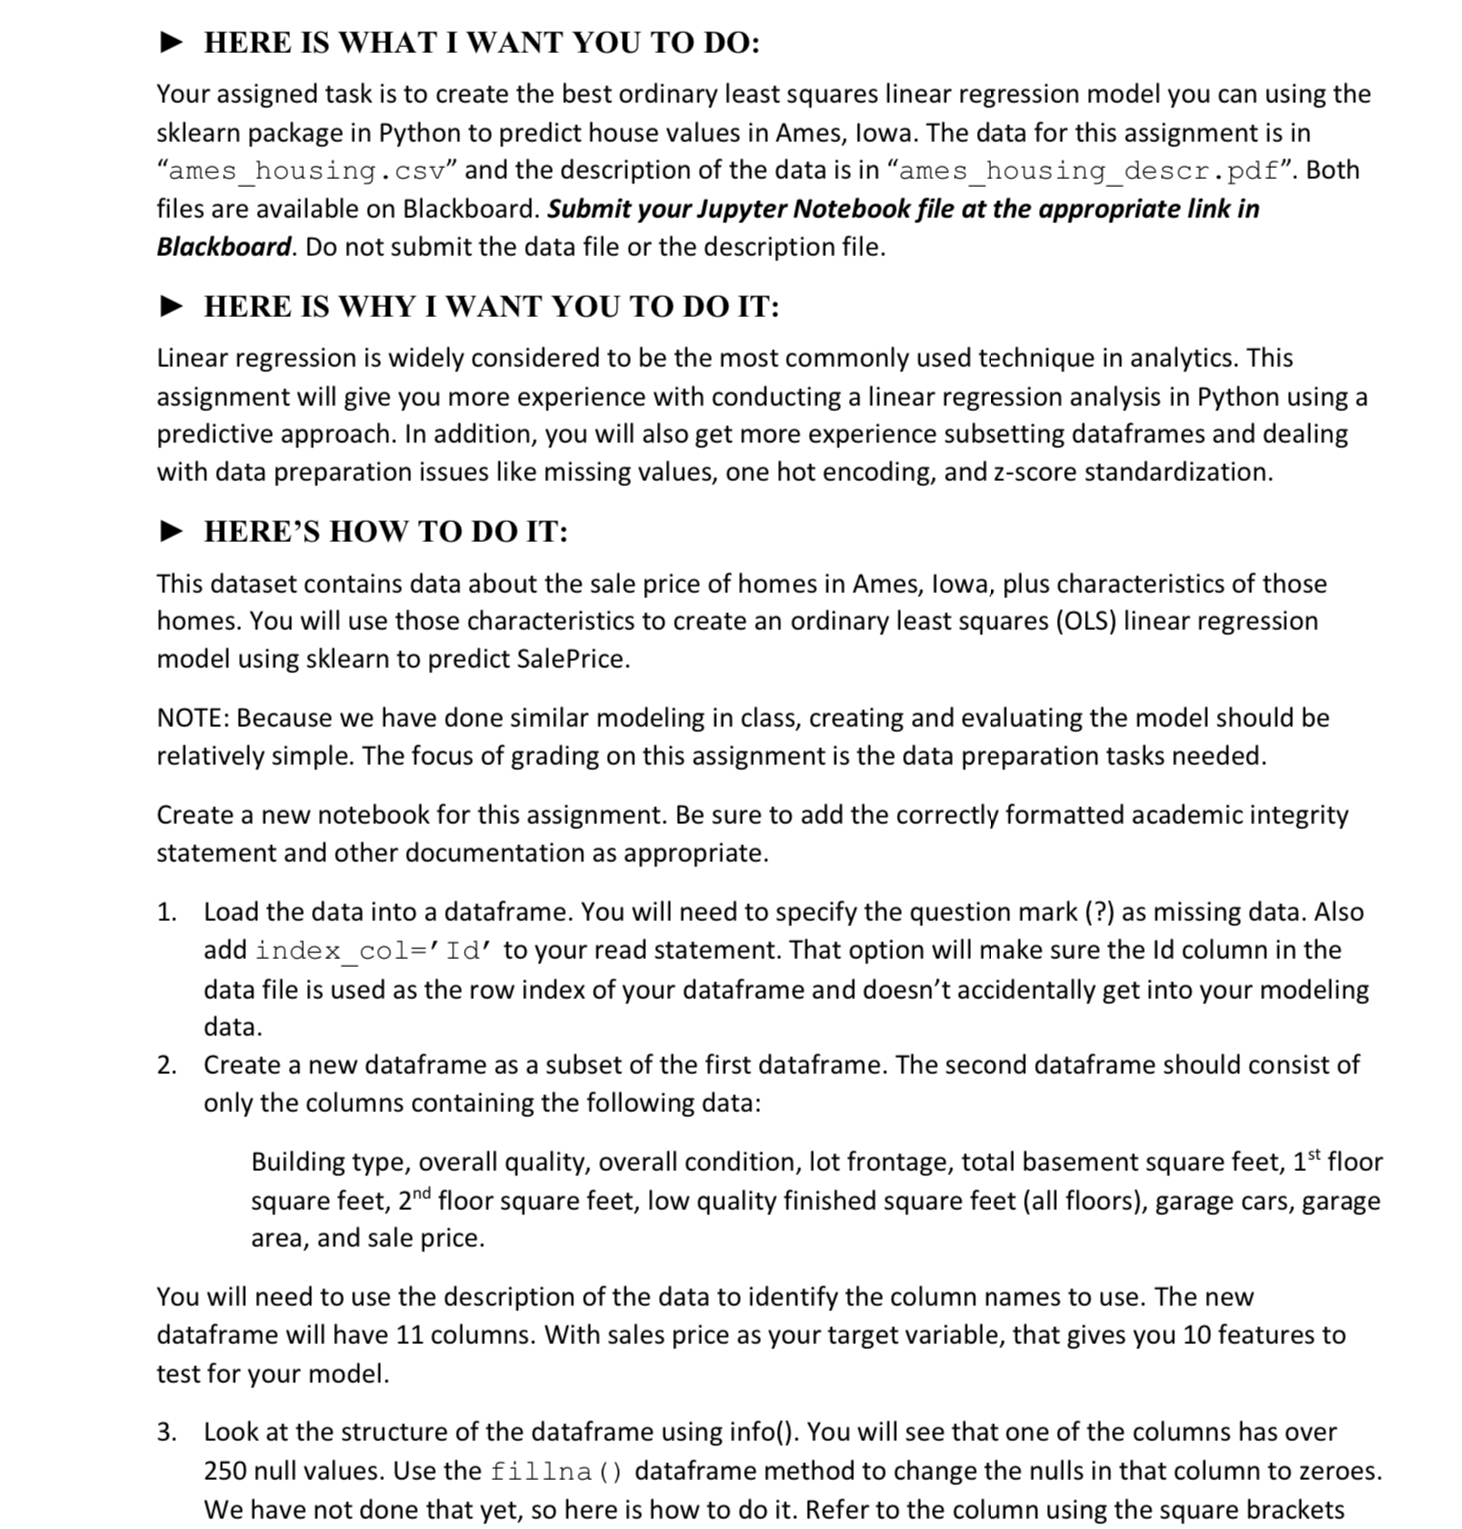
HERE IS WHAT I WANT YOU TO DO:
Your assigned task is to create the best ordinary least squares linear regression model you can using the sklearn package in Python to predict house values in Ames, lowa. The data for this assignment is in "ameshousing.csv and the description of the data is in "ameshousingdescr.pdf Both files are available on Blackboard. Submit your Jupyter Notebook file at the appropriate link in Blackboard. Do not submit the data file or the description file.
HERE IS WHY I WANT YOU TO DO IT:
Linear regression is widely considered to be the most commonly used technique in analytics. This assignment will give you more experience with conducting a linear regression analysis in Python using a predictive approach. In addition, you will also get more experience subsetting dataframes and dealing with data preparation issues like missing values, one hot encoding, and zscore standardization.
HERE'S HOW TO DO IT:
This dataset contains data about the sale price of homes in Ames, lowa, plus characteristics of those homes. You will use those characteristics to create an ordinary least squares OLS linear regression model using sklearn to predict SalePrice.
NOTE: Because we have done similar modeling in class, creating and evaluating the model should be relatively simple. The focus of grading on this assignment is the data preparation tasks needed.
Create a new notebook for this assignment. Be sure to add the correctly formatted academic integrity statement and other documentation as appropriate.
Load the data into a dataframe. You will need to specify the question mark as missing data. Also add indexcol Id to your read statement. That option will make sure the Id column in the data file is used as the row index of your dataframe and doesn't accidentally get into your modeling data.
Create a new dataframe as a subset of the first dataframe. The second dataframe should consist of only the columns containing the following data:
Building type, overall quality, overall condition, lot frontage, total basement square feet, floor square feet, floor square feet, low quality finished square feet all floors garage cars, garage area, and sale price.
You will need to use the description of the data to identify the column names to use. The new dataframe will have columns. With sales price as your target variable, that gives you features to test for your model.
Look at the structure of the dataframe using info You will see that one of the columns has over null values. Use the fillna dataframe method to change the nulls in that column to zeroes. We have not done that yet, so here is how to do it Refer to the column using the square brackets
Step by Step Solution
There are 3 Steps involved in it
Step: 1

Get Instant Access to Expert-Tailored Solutions
See step-by-step solutions with expert insights and AI powered tools for academic success
Step: 2

Step: 3
Ace Your Homework with AI
Get the answers you need in no time with our AI-driven, step-by-step assistance
Get Started
MySQL Crash Course A Hands On Introduction To Database Development
Authors: Rick Silva
1st Edition
1718503008, 978-1718503007