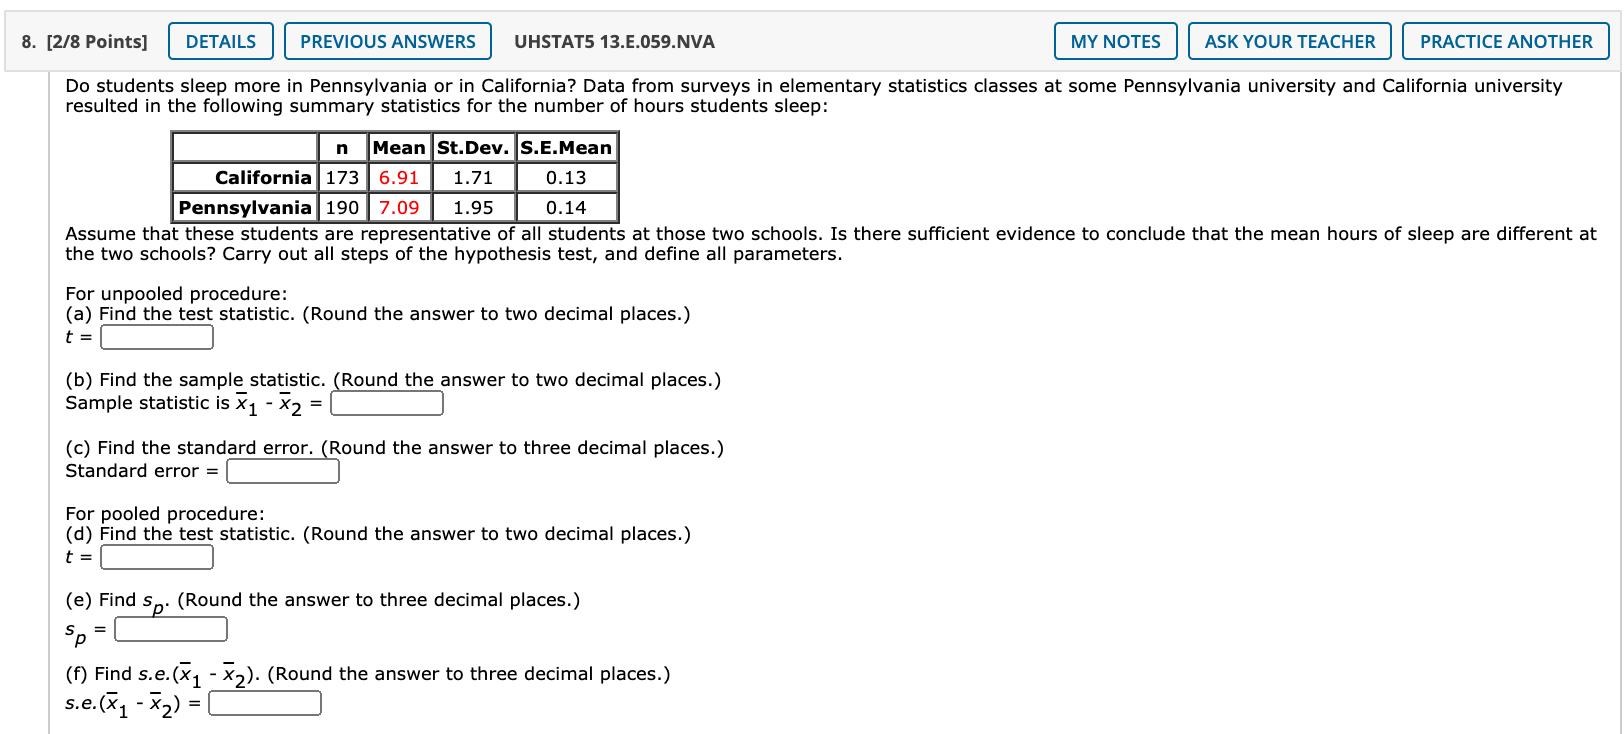
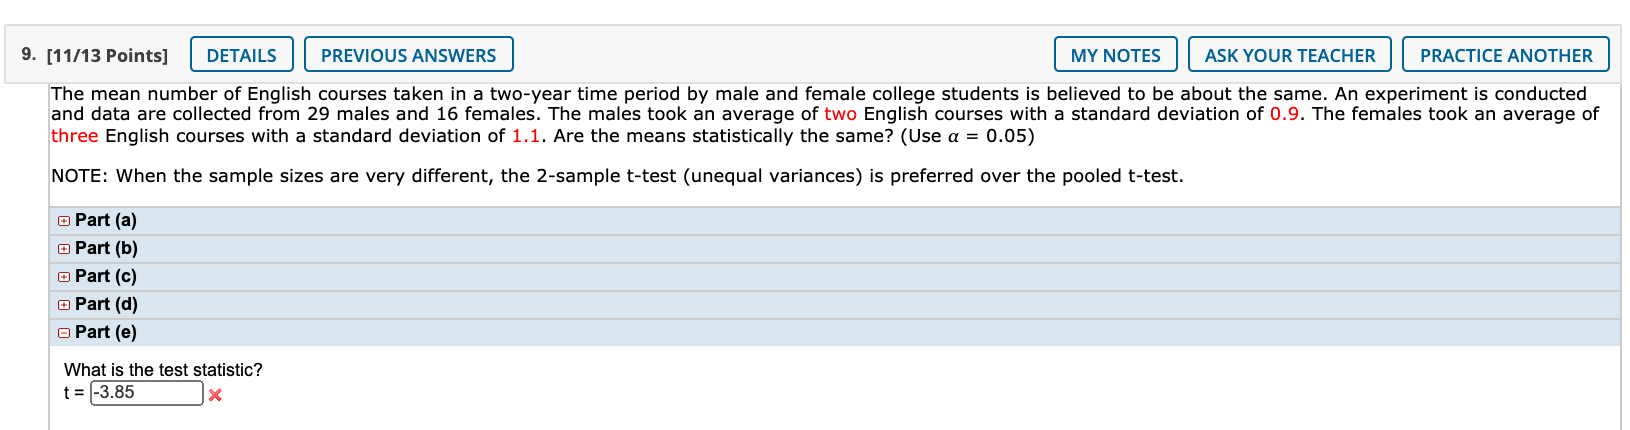
hey i need help with this
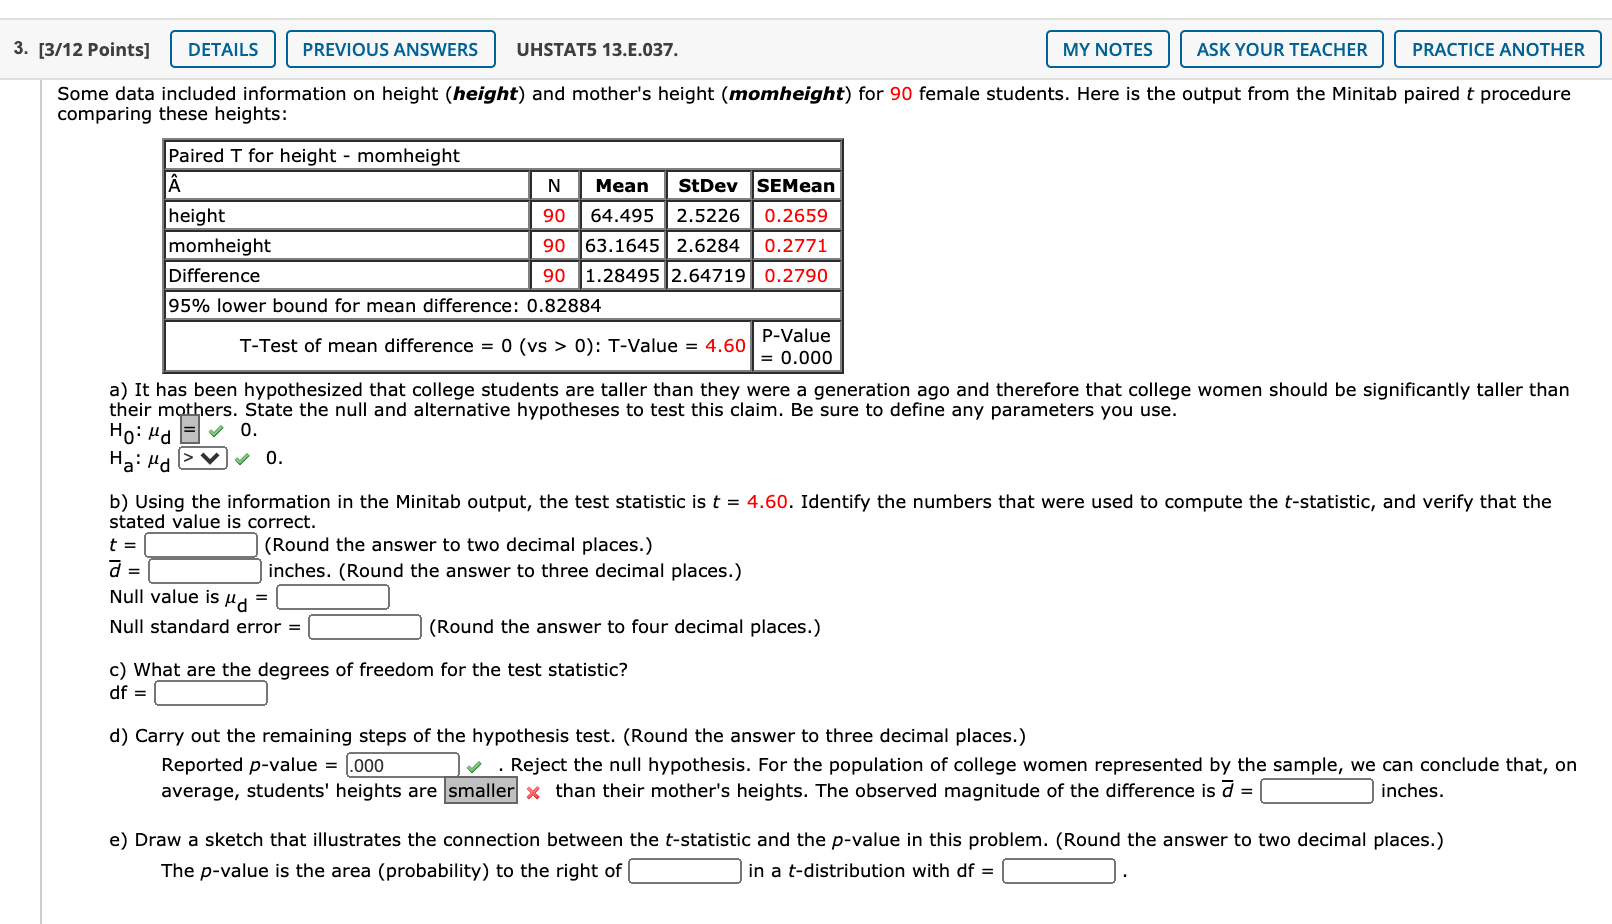
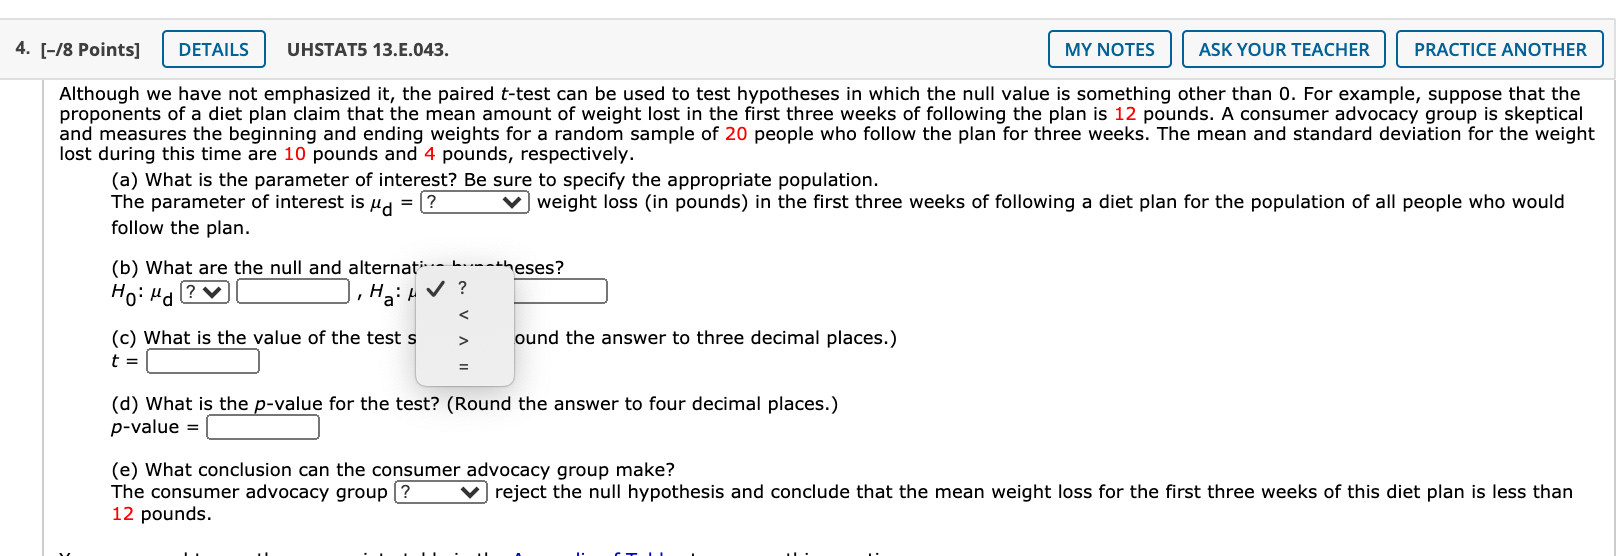
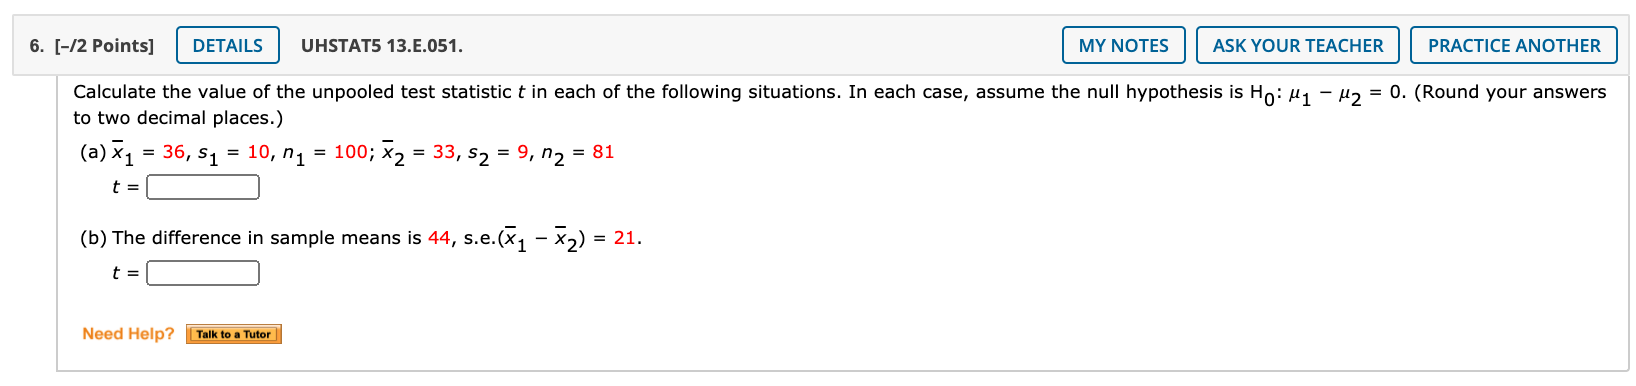
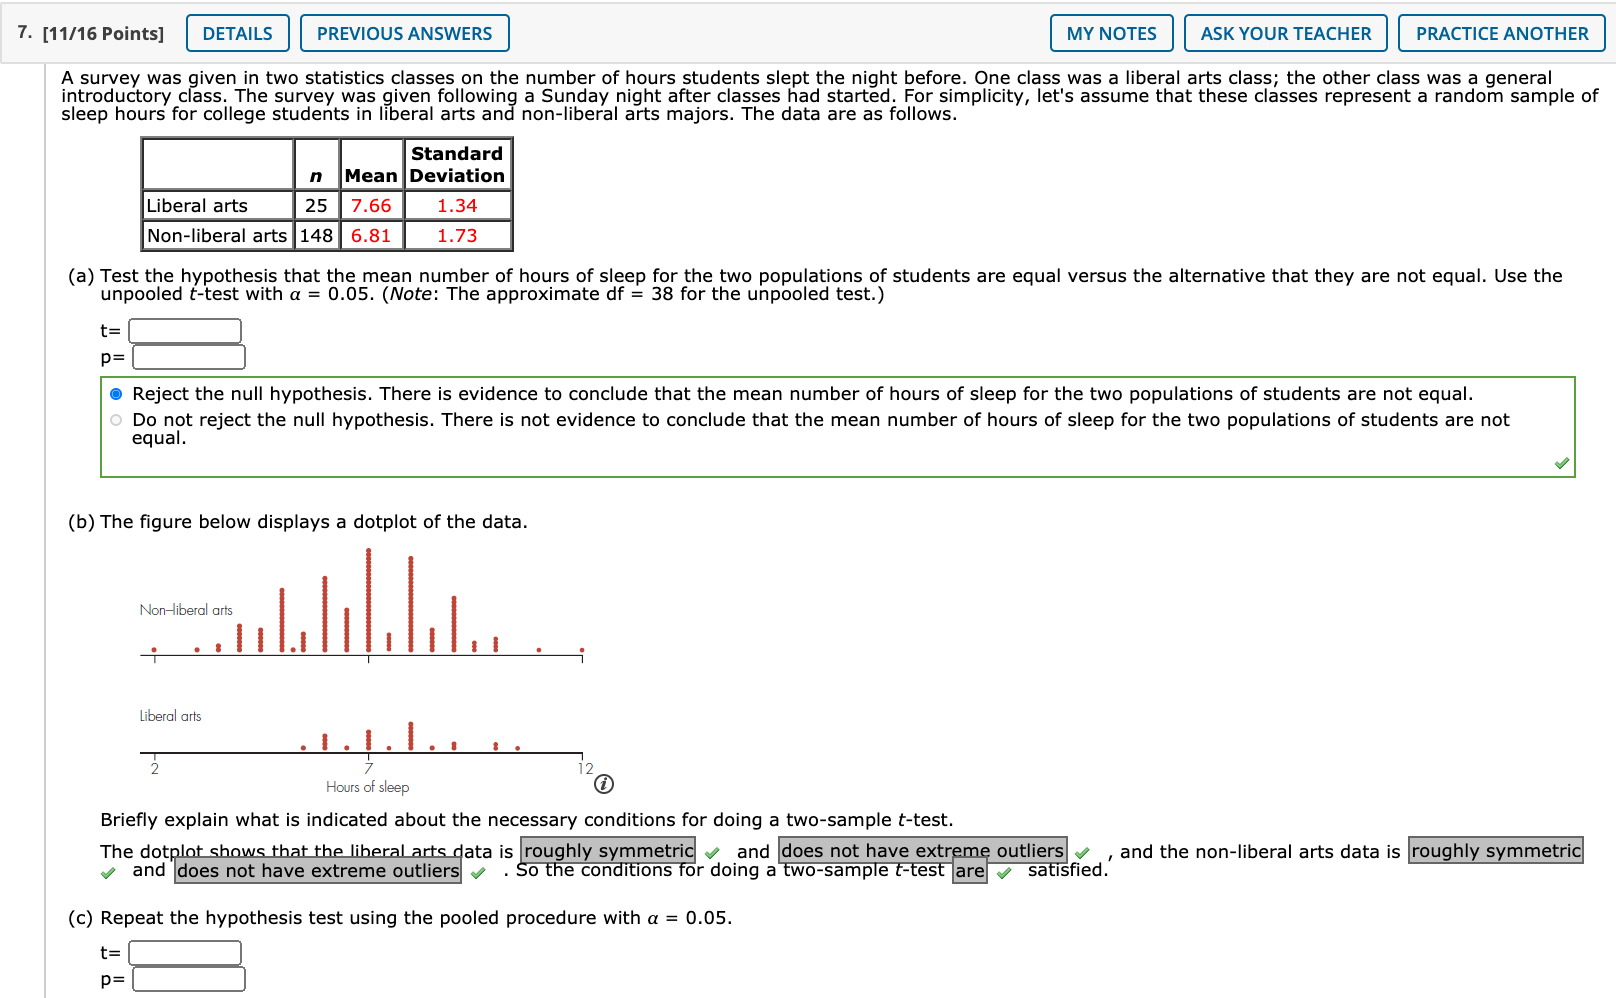
3- [3112 Points] DETAILS PREVIOUS ANSWERS UHSTATS 131.037. MY NOTES MK YOUR TEACHER PRACTICE ANOTHER Some data included information on height (height) and mother's height (momheight) for 90 female students. Here is the output from the Minitab paired t procedure comparing these heights: Paired T for height - momheight um eight E_- El momheight 0-2771 --EI 0-2790 95% lower bound for mean difference: 0.32384 P-Val ue T-Test of mean difference = D (vs > O): T-Value = 4.60 = 0-000 a) It has been hypothesized that college students are taller than they were a generation ago and therefore that college women should be signicantly taller than their m ers. State the null and alternative hypotheses to test this claim. Be sure to dene any parameters you use. 'I O. b) Using the information in the Minitab output, the test statistic is t = 4.60. Identify the numbers that were used to compute the t-statistic, and verify that the stated value is correct. 1' = (Round the answer to two decimal places.) a = inches. (Round the answer to three decimal places.) Null value is \"d = :] Null standard error = :] (Round the answer to four decimal places.) c) What are the degrees of freedom for the test statistic? .. = :1 d) Carry out the remaining steps of the hypothesis test. (Round the answer to three decimal places.) Reported pvalue = [E- ./ . Reject the null hypothesis. For the population of college women represented by the sample, we can conclude that, on average, students' heights are x than their mother's heights. The observed magnitude of the difference is 5' = :] inches. e) Draw a sketch that illustrates the connection between the tstatistic and the p-value in this problem. (Round the answer to two decimal places.) The pvalue is the area (probability) to the right of[:] in a tdistribution with df = [:] . 4. [-18 Points] DEI' LS UHSTATS 13.E.l343. MY NOTES ASK YOUR TEACHER PRACTICE ANOTHER Although we have not emphasized it, the paired ttest can be used to test hypotheses in which the null value is something other than 0. For example, suppose that the proponents of a diet plan claim that the mean amount of weight lost in the rst three weeks of following the plan is 12 pounds. A consumer advocacy group is skeptical and measures the beginning and ending weights for a random sample of 20 people who follow the plan for three weeks. The mean and standard deviation for the weight lost during this time are 10 pounds and 4 pounds, respectively. (a) What is the parameter of interest? Be sure to specify the appropriate population. The parameter of interest is "d = weight loss (in pounds) in the rst three weeks of following a diet plan for the population of all people who would follow the plan. (b) What are the null and alternat' """ \"-\"heses? . . 'J Ho.udn:i.+r.. - und the answer to three decimal places.) (d) What is the -value for the test? (Round the answer to four decimal places.) p-vauue = :1 (e) What conclusion can the consumer advocacy group make? The consumer advocacy group reject the null hypothesis and conclude that the mean weight loss for the rst three weeks of this diet plan is less than 12 pounds. 6. [-/2 Points] DETAILS UHSTAT5 13.E.051. MY NOTES ASK YOUR TEACHER PRACTICE ANOTHER Calculate the value of the unpooled test statistic t in each of the following situations. In each case, assume the null hypothesis is Ho: M1 - #2 = 0. (Round your answers to two decimal places.) (a) x1 = 36, S1 = 10, n1 = 100; x2 = 33, 52 = 9, 02 = 81 t = (b) The difference in sample means is 44, s.e.(x1 - x2) = 21. t = Need Help? Talk to a Tutor7. [11/16 Points] DETAILS PREVIOUS ANSWERS MY NOTES ASK YOUR TEACHER PRACTICE ANOTHER A survey was given in two statistics classes on the number of hours students slept the night before. One class was a liberal arts class; the other class was a general introductory class. The survey was given following a Sunday night after classes had started. For simplicity, let's assume that these classes represent a random sample of sleep hours for college students in liberal arts and non-liberal arts majors. The data are as follows. Standard n Mean Deviation Liberal arts 25 7.66 1.34 Non-liberal arts 148 6.81 1.73 (a) Test the hypothesis that the mean number of hours of sleep for the two populations of students are equal versus the alternative that they are not equal. Use the unpooled t-test with a = 0.05. (Note: The approximate df = 38 for the unpooled test.) t= P= Reject the null hypothesis. There is evidence to conclude that the mean number of hours of sleep for the two populations of students are not equal. O Do not reject the null hypothesis. There is not evidence to conclude that the mean number of hours of sleep for the two populations of students are not equal. (b) The figure below displays a dotplot of the data. Non-liberal arts Liberal arts 2 Hours of sleep Briefly explain what is indicated about the necessary conditions for doing a two-sample t-test. The dotplot shows that the liberal arts data is roughly symmetric , and does not have extreme outliers and does not have extreme outliers v . So the conditions for doing a two-sample t-test are