

Answered step by step
Verified Expert Solution
Question
1 Approved Answer
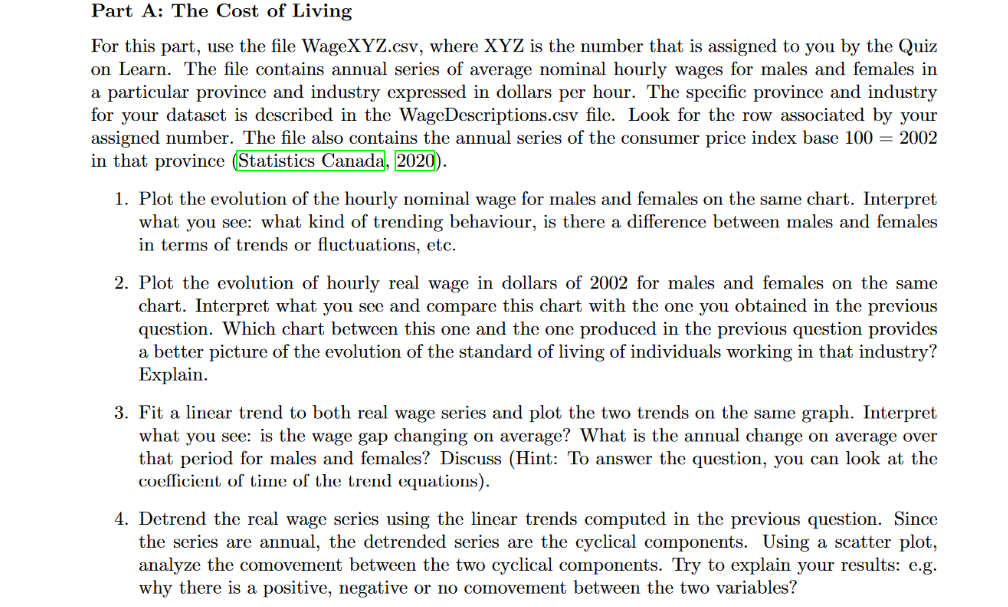
Hey please help me answer this question please add steps you followed to generate the data in excel. URGENT Thanks Year Males Females CPI 1997
Hey please help me answer this question please add steps you followed to generate the data in excel.
URGENT
Thanks
| Year | Males | Females | CPI |
| 1997 | 18.1 | 13.21 | 90 |
| 1998 | 20.1 | 12.64 | 90.6 |
| 1999 | 19.86 | 13.99 | 92.1 |
| 2000 | 21.36 | 14.78 | 95.3 |
| 2001 | 22.16 | 17.04 | 97.1 |
| 2002 | 23.73 | 17.13 | 100 |
| 2003 | 24.6 | 18.67 | 103.4 |
| 2004 | 23.32 | 16.93 | 105.3 |
| 2005 | 24.97 | 18.8 | 108.2 |
| 2006 | 25.27 | 17.78 | 110.4 |
| 2007 | 26.24 | 19.78 | 112.5 |
| 2008 | 24.9 | 19.54 | 115.9 |
| 2009 | 28.33 | 22.29 | 115.7 |
| 2010 | 29.09 | 22.42 | 118.2 |
| 2011 | 26.98 | 21.31 | 122.7 |
| 2012 | 28.34 | 22.83 | 125.1 |
| 2013 | 29.4 | 22.09 | 126.6 |
| 2014 | 31.93 | 25.24 | 128.8 |
| 2015 | 29.66 | 23.69 | 129.3 |
| 2016 | 33.16 | 24.32 | 130.9 |
| 2017 | 31.38 | 27.85 | 132.4 |
| 2018 | 32.45 | 28.01 | 135.3 |
| 2019 | 33.95 | 26.99 | 137.5 |
Step by Step Solution
There are 3 Steps involved in it
Step: 1

Get Instant Access to Expert-Tailored Solutions
See step-by-step solutions with expert insights and AI powered tools for academic success
Step: 2

Step: 3
Ace Your Homework with AI
Get the answers you need in no time with our AI-driven, step-by-step assistance
Get Started
Understanding Business
Authors: William NickelsJames McHughSusan McHugh
12th Edition
1259929434, 9781259929434