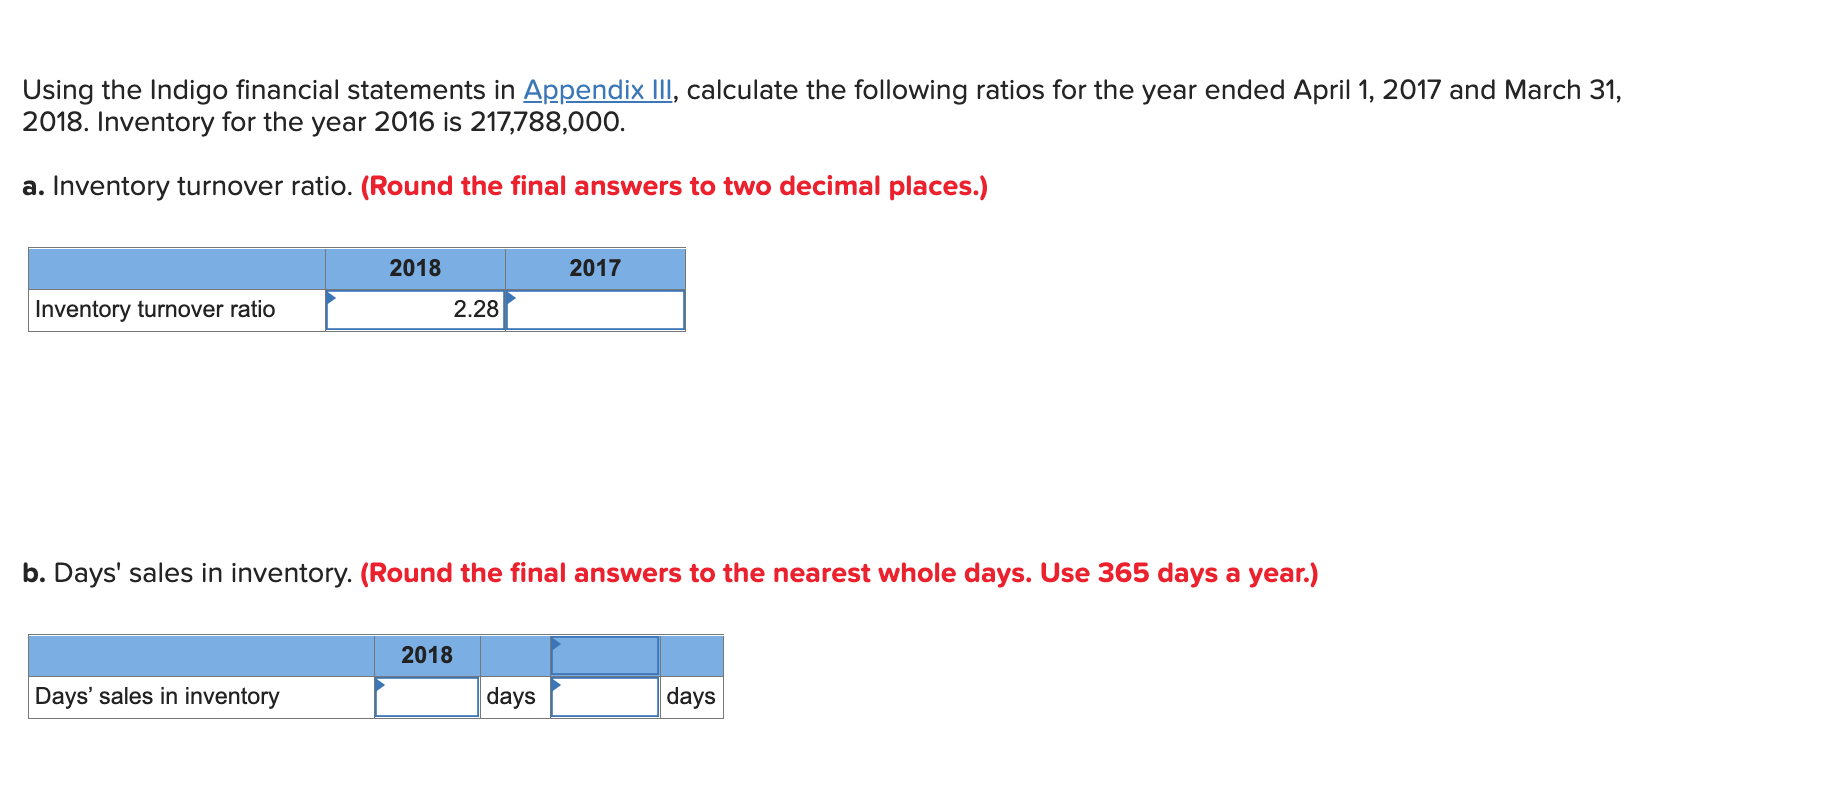
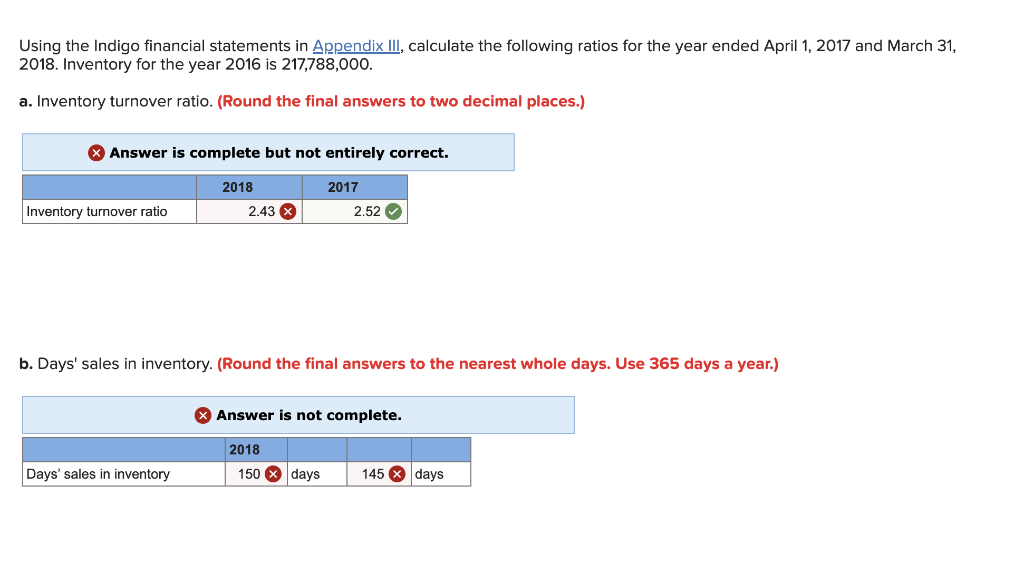
Hi again, I posted the below question yesterday. It looks like the answer was close but 3 are still wrong. (see below pic) Can someone please re-visit this for me.
Please help me with this last question...I am on my second glass of wine and ready to quick accounting school! Thank you!!!!


Show transcribed data
Expert Answer
100% (1 rating)
Anonymous answered this730 answers
Answers :
(a)
2017=2.52
2018=2.43
(b)
2017=145days
2018 = 150 days
(a)
Inventory Turnover Ratio = Cost of Goods Sold / Avg. Inventory
Average inventory = (beginning inventory + ending inventory) / 2
For 2017 :-
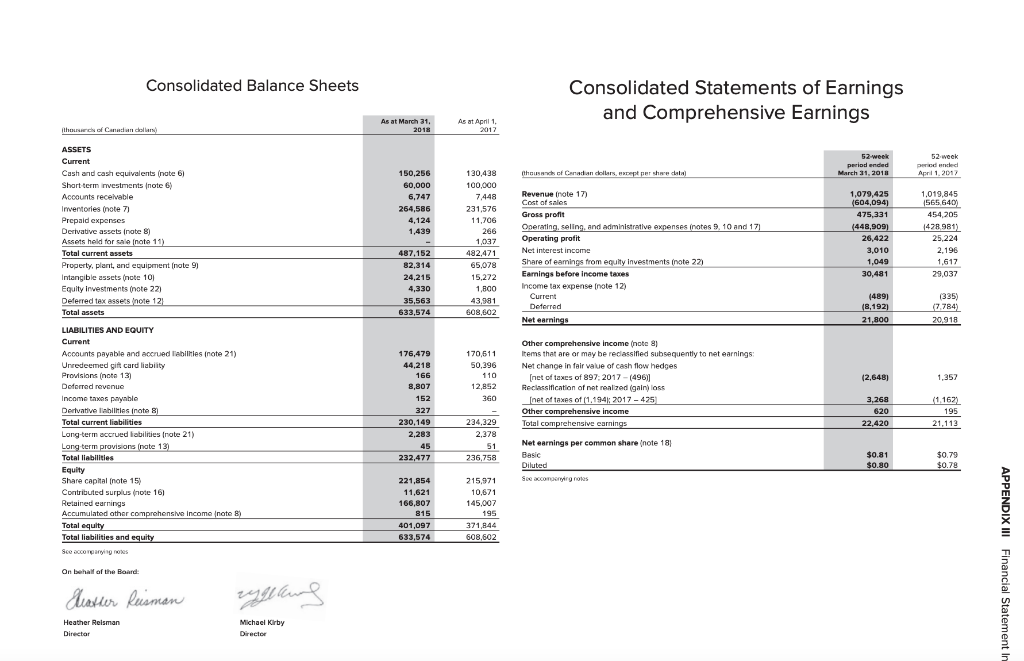
= 565,640,000 / (217,788,000+231,576,000/2
= 565640000 / 224682000
= 2.52
For 2018:-
=604094/(231576+264586/2)
=2.43
(b)
Day sales in inventory
= Avg inventory / cost of goods sold x 365
For 2017 :-
=224682/565640*365
=145days
For 2018 :
= 248081/604094*365
=150 days
Was this answer helpful?

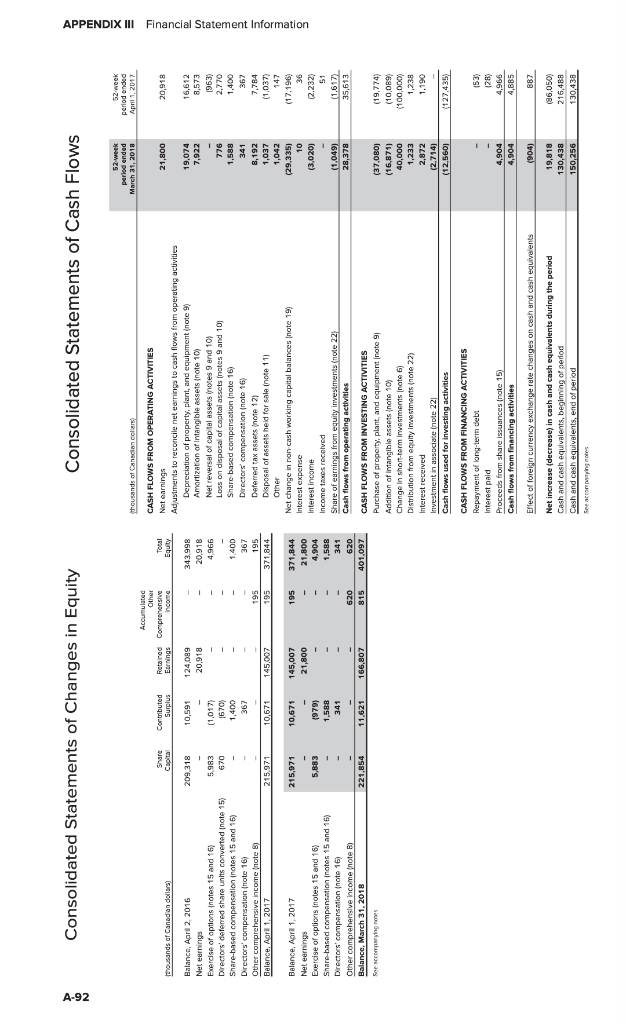
Using the Indigo financial statements in Appendix III, calculate the following ratios for the year ended April 1, 2017 and March 31, 2018. Inventory for the year 2016 is 217,788,000. a. Inventory turnover ratio. (Round the final answers to two decimal places.) Inventory turnover ratio 2018 Days' sales in inventory 2.28 b. Days' sales in inventory. (Round the final answers to the nearest whole days. Use 365 days a year.) 2018 2017 days days Consolidated Statements of Changes in Equity thousands of Canadian dollars) Balance, April 2, 2016 Net earnings Exercise of options (notes 15 and 16) Directors' deferred share units converted (note 15) Share-based compensation (notes 15 and 16) Directors' compensation (note 16) Other compreh Belance, April 1, 2017 prehensive income (note 8) Balance, April 1, 2017 Net earnings Exercise of options (notes 15 and 16) Share-based compensation (notes 15 and 16) Directors' compensation (note 16) Other comprehensive income (note 8) Balance, March 31, 2018 See accompanying notes Share Capita 209,318 5,983 6/0 215,971 215,971 - 5,883 221,854 Contributed Surplus 10,591 (1,017) (670) 1,400 367 10,671 10,671 (979) 1,588 341 11,621 Retained Comprehensive Earnings 124,089 20,918 - 145,007 145,007 21,800 - ALL 166,807 Income - 195 195 195 - 620 815 Total Equity 343,998 20,918 4,966 1,400 367 195 371,844 371,844 21,800 4,904 1,588 341 620 401,097 Consolidated Statements of Cash Flows thousands of Canadian collars) CASH FLOWS FROM OPERATING ACTIVITIES Net earnings Adjustments to reconcile net earnings to cash flows from operating activities Depreciation of property, plant, and equipment (note 9) Amortization of intangible assets (note 10) Net reversal of capital assets (notes 9 and 10) Loss on disposal of capital assets (notes 9 and 10) Share based compensation (note 16) Directors' compensation (note 16) Deferred tax assets (note 12) Disposal of assets held for sale (note 11) Other Net change in non-cash working capital balances (note 19) Interest expense Interest income Income taxes received Share of earnings from equity investments (note 22) Cash flows from operating activities CASH FLOWS FROM INVESTING ACTIVITIES Purchase of property, plant, and equipment (note 9) Addition of intangible assets (note 10) Change in short-term investments (note 6) Distribution from equity Investments (note 22) Interest received Investment in associate (note 22) Cash flows ed for investing activities CASH FLOWS FROM FINANCING ACTIVITIES Repayment of long-term debt Interest paid Proceeds from share issuances (note 15) Cash flows t financing activities Effect of foreign currency exchange rate changes on cash and cash equivalents Net increase (decrease) in cash and cash equivalents during the period Cash and cash equivalents, beginning of period Cesh and cesh equivalents, end of period See accompanying notes 52-week period ended March 31, 2018 21,800 19,074 7,922 - 776 1,588 341 8,192 1,037 1,042 (29,335) 10 (3,020) (1.049) 28,378 (37,080) (16,871) 40,000 1,233 2,872 (2,714) (12,560) 4,904 4,904 (904) 19,818 130,438 150,256 52-week period ended April 1, 2017 20,918 16,612 8,573 (963) 2,770 1,400 367 7,784 (1,037) 147 (17,196) 36 (2,232) 51 ((1.617) 35,613 (19,774) (10,089) (100,000) 1,238 1,190 (127,435) (53) (28) 4,966 4,885 887 (86,050) 216,488 130,438 APPENDIX III Financial Statement Information Consolidated Balance Sheets (thousands of Canadian colland ASSETS Current Cash and cash equivalents (nate 6) Short term investments (note 6) Accounts receivable Inventories (note 7) Prepaid expenses Derivative assets (note 8) to hold for sale innt Assets held for sale (note 11) Total current assets Property, plant, and equipment (note 9) Intangible assets (note 10) Equity Investments (note 22) Deferred tax assets (note 12) Total assets LIABILITIES AND EQUITY Current Accounts payable and accrued liabilities (note 21) Unredeemed gift card liability Provisions (note 13) www. Deferred revenue Income taxes payable Derivative labilities (note 8) Total current liabilities Long-term accrued liabilities (note 21) Long-term provisions (note 13) Total liabilities Equity Share capital (note 15) Contributed surplus (note 16) Retained earnings Accumulated other comprehensive Income (note 8) Total equity Total liabilities and equity See accompanying notes On behalf of the Board Heather Reisman Heather Reisman Director ringlang Michael Kirby Director As at March 31, 2018 150,256 60,000 6,747 264,586 4,124 1,439 487,152 82,314 24,215 4,330 35,563 633,574 176,479 44,218 166 8,807 152 327 230,149 2,283 45 232,477 221,854 11,621 166,807 815 401,097 633,574 As at April 1, 2017 130,438 100,000 7,448 231,576 11,706 266 1,037 482,471 65,078 15,272 1,800 43,981 608,602 170,511 50,396 110 12,852 360 234,329 2,378 51 236,758 215,971 10,671 145.007 195 371,844 608,602 Consolidated Statements of Earnings and Comprehensive Earnings thousands of Canadian dollars, except per share data) Revenue (note 17) Cost of sales Gross profit Operating, seling, and administrative expenses (notes 9, 10 and 17) Operating profit Net interest income Share of eamings from equity Investments (note 22) Earnings before income taxes Income tax expense [note 12) Current Deferred Net earnings Other comprehensive income (note 8) comprehensiv Items that are or may be reclassified subsequently to net earnings: Net change in fair value of cash flow hedges [net of taxes of 897; 2017-(496)) Reclassification of net realized (gain) loss [net of taxes of (1,194); 2017-425) Other comprehensive income Total comprehensive earnings Net earnings per common share (note 18) Basic Diluted See accompanying notes 52-week period ended March 31, 2018 1,079,425 (604,094) 475,331 (448,909) 26,422 3,010 1,049 30,481 (489) (8,192) 21,800 (2,648) 3,268 620 22,420 $0.81 $0.80 52 week period ended April 1, 2017 1,019,845 (565,640) 454,205 (428,981) 25,224 2.196 1,617 29,037 (335) (7.784) 20,918 1,357 (1,162) 195 21,113 $0.79 $0.78 APPENDIX III Financial Statement I Using the Indigo financial statements in Appendix III, calculate the following ratios for the year ended April 1, 2017 and March 31, 2018. Inventory for the year 2016 is 217,788,000. a. Inventory turnover ratio. (Round the final answers to two decimal places.) Answer is complete but not entirely correct. Inventory turnover ratio 2018 Days' sales in inventory 2.43 X b. Days' sales in inventory. (Round the final answers to the nearest whole days. Use 365 days a year.) 2017 2018 2.52 Answer is not complete. 150 x days 145 x days


