Answered step by step
Verified Expert Solution
Link Copied!

Question

1 Approved Answer

Hi am looking for help to checking my work and cleaning up the formatting of an excel document. Below I have copied the problem statement

Hi am looking for help to checking my work and cleaning up the formatting of an excel document. Below I have copied the problem statement and attached the excel document.

A power plant releases its exhaust gases through a stack with the following characteristics:

Stack height = 215 m

Inside diameter = 6.7 m

Stack gas velocity = 21 m/s

Stack temperature = 125 oC

Average temperature at surface = 10 oC

SO2 emission rate = 1000 g/s.

(a)For each condition, determine the plume rise and uH.

(b)Estimate the ground-level SO2 concentration directly downwind (along the horizontal centerline: y=0) at stability categories A through F, when the wind speed is 2.1 m/s at 10 m, for at least 10 distances between 0.25 and 150 km downwind.Assume isothermal conditions (ELR) for stability categories E and F.

(c)For the same conditions as (b) estimate the maximum concentration and distance downwind at which this concentration occurs.

(d)Present this data obtained above in tabular form, and graphically.If you use Excel or MatLab, you should submit your code/spreadsheet.

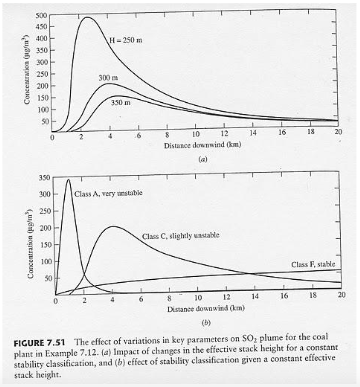
image text in transcribedimage text in transcribed
Part A Part B Given Stack Height (m) Inside Diameter (m) Stack Gas Velocity (m/s) Stack Temperature (deg C) -- K Average Temperature at Surface (deg C) -- K SO2 Emission Rate (g/s) -- micrograms/sec Windspeed at 10 m (m/s) Condition A Very Unstable B Moderately Unstable C Slightly Unstable D Neutral E Slightly Stable F Stable 215 6.7 21 125 10 1000 2.1 Exp 0.15 0.15 0.20 0.25 0.40 0.60 Condition x==1 km d 2.094 1.098 0.911 0.516 0.305 0.18 3.66E-20 8.61E-03 2.09E+01 3.17E+01 6.92E+00 1.80E+00 4.57E-01 2.04E-01 b 1.17E-71 1.74E-18 7.75E-04 1.08E+01 1.70E+01 6.93E+00 2.19E+00 1.08E+00 c -2.72 -2.19 -2.00 -1.56 -2.59 -3.23 B 5.39E-99 9.26E-37 9.65E-16 1.52E-05 6.92E-02 9.33E-01 2.79E+00 3.55E+00 0.00E+00 0.00E+00 0.00E+00 0.00E+00 0.00E+00 0.00E+00 0.00E+00 0.00E+00 E 3.73E-08 3.81E+00 3.31E+02 4.82E+02 F 2.42E-09 1.15E-01 3.31E+02 2.22E+04 d 0.13 0.04 0.00 -0.09 0.22 0.50 0.00 0.00 0.00 0.00 -0.03 -0.08 1.10E-07 2.03E+01 8.01E+02 1.69E+01 D 1.34E-08 1.96E+00 8.01E+02 2.79E+02 C 2.28E-07 5.35E+01 8.01E+02 6.18E+00 2.85E-277 1.43E-105 3.89E-43 1.15E-13 3.52E-04 1.32E-01 1.24E+00 1.96E+00 er hilighted in this color seperated by this color info/Variables in this color >=1 km f -9.6 2 0 -13 -34 -48.6 D sig_y 19.69 36.59 68.00 126.37 234.83 532.73 1208.56 2245.89 4173.58 5997.01 E sig_z 10.45 18.39 31.50 50.63 78.00 133.00 221.26 321.99 466.03 577.50 sig_y 14.62 27.18 50.50 93.85 174.39 395.63 897.53 1667.90 3099.50 4453.66 F sig_z 7.61 12.95 21.50 34.44 50.55 77.82 113.87 148.68 191.69 221.40 sig_y 9.85 18.30 34.00 63.18 117.41 266.37 604.28 1122.94 2086.79 2998.50 sig_z 4.79 8.24 14.00 22.32 31.74 46.15 63.14 77.99 94.81 105.67 Part D 9.00E+01 8.00E+01 7.00E+01 6.00E+01 5.00E+01 Concentration 4.00E+01 3.00E+01 2.00E+01 1.00E+01 0.00E+00 0 20 40 60 80 Distance Downwind 100 120 100 120 140 160 \f

Step by Step Solution

There are 3 Steps involved in it

Step: 1

blur-text-image

Get Instant Access to Expert-Tailored Solutions

See step-by-step solutions with expert insights and AI powered tools for academic success

Step: 2

blur-text-image

Step: 3

blur-text-image

Ace Your Homework with AI

Get the answers you need in no time with our AI-driven, step-by-step assistance

Get Started

Recommended Textbook for

Statistical Inference

Authors: George Casella, Roger L. Berger

2nd edition

0534243126, 978-0534243128

More Books

Students also viewed these Mathematics questions