Hi, am trying to complete the inferential statistics portion of my survey using hypothesis testing and research summary but am stuck on the conclusion can I get a little help
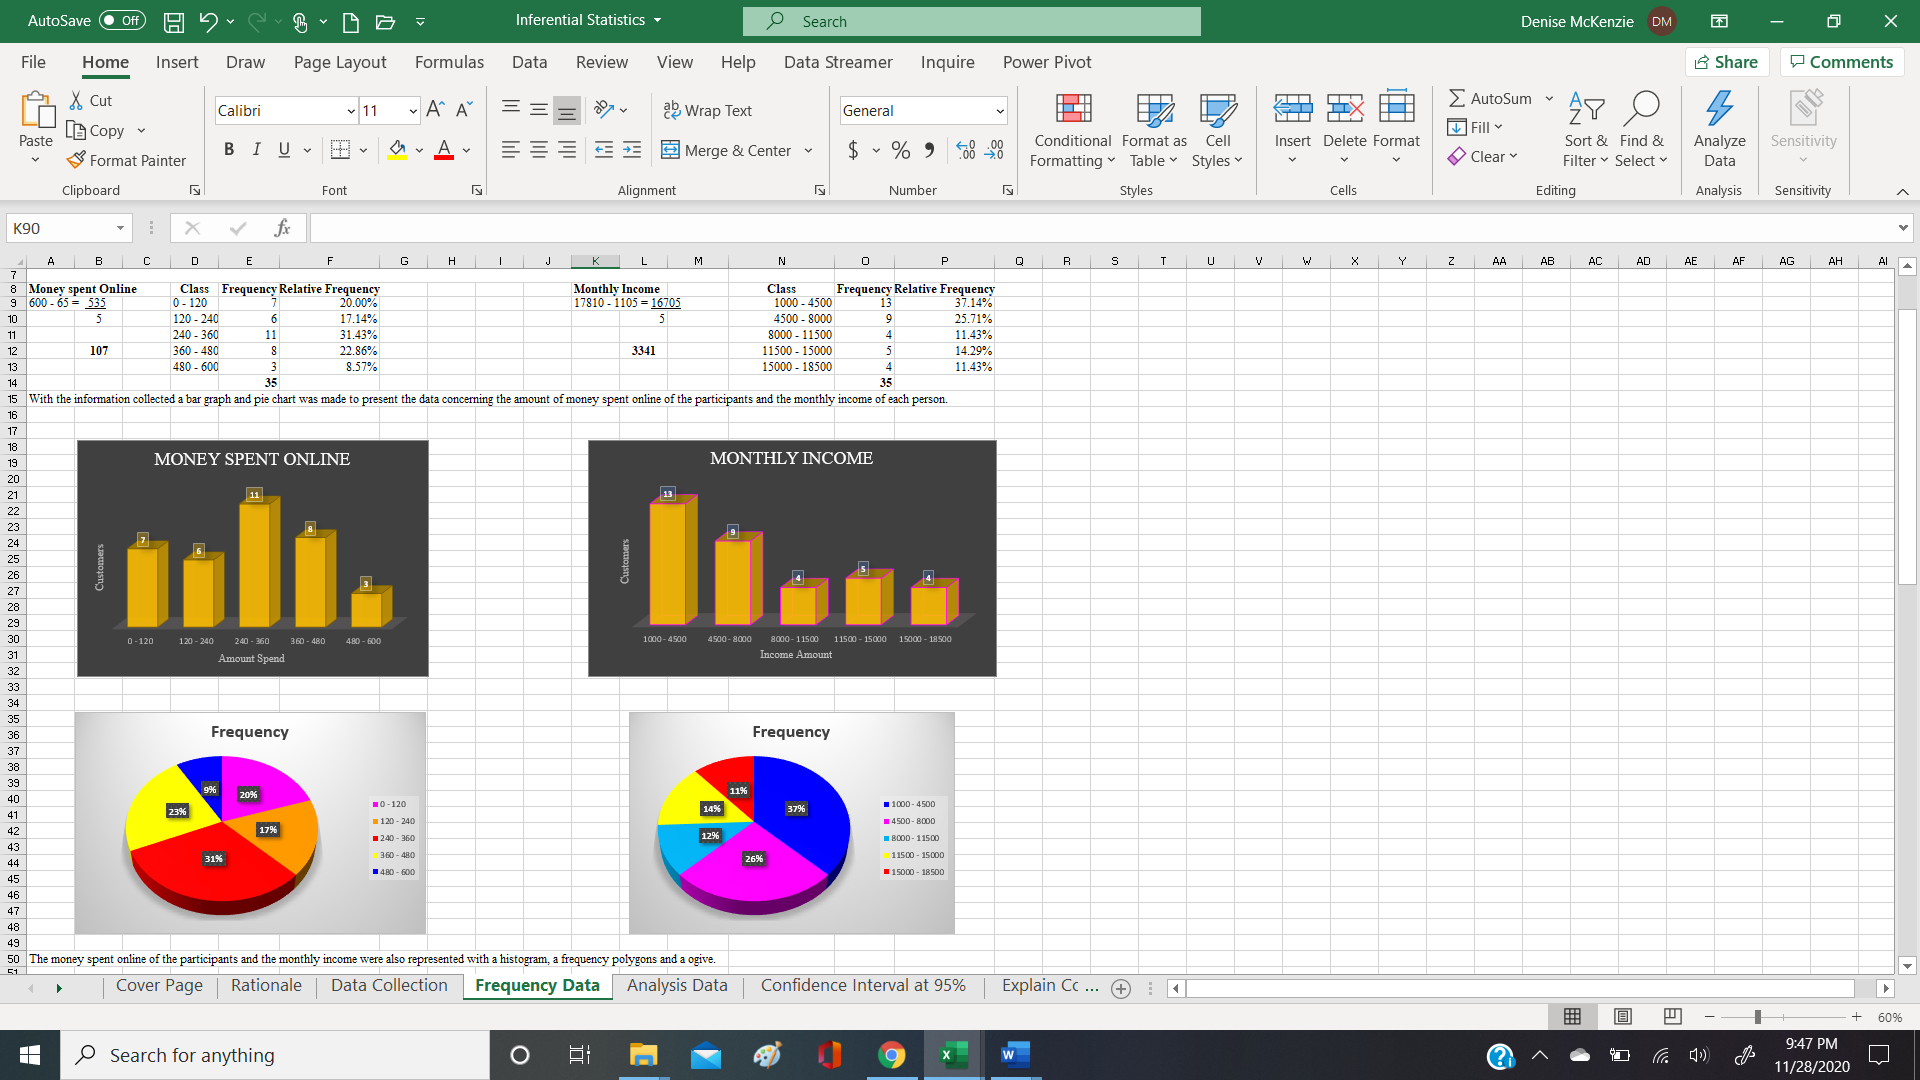
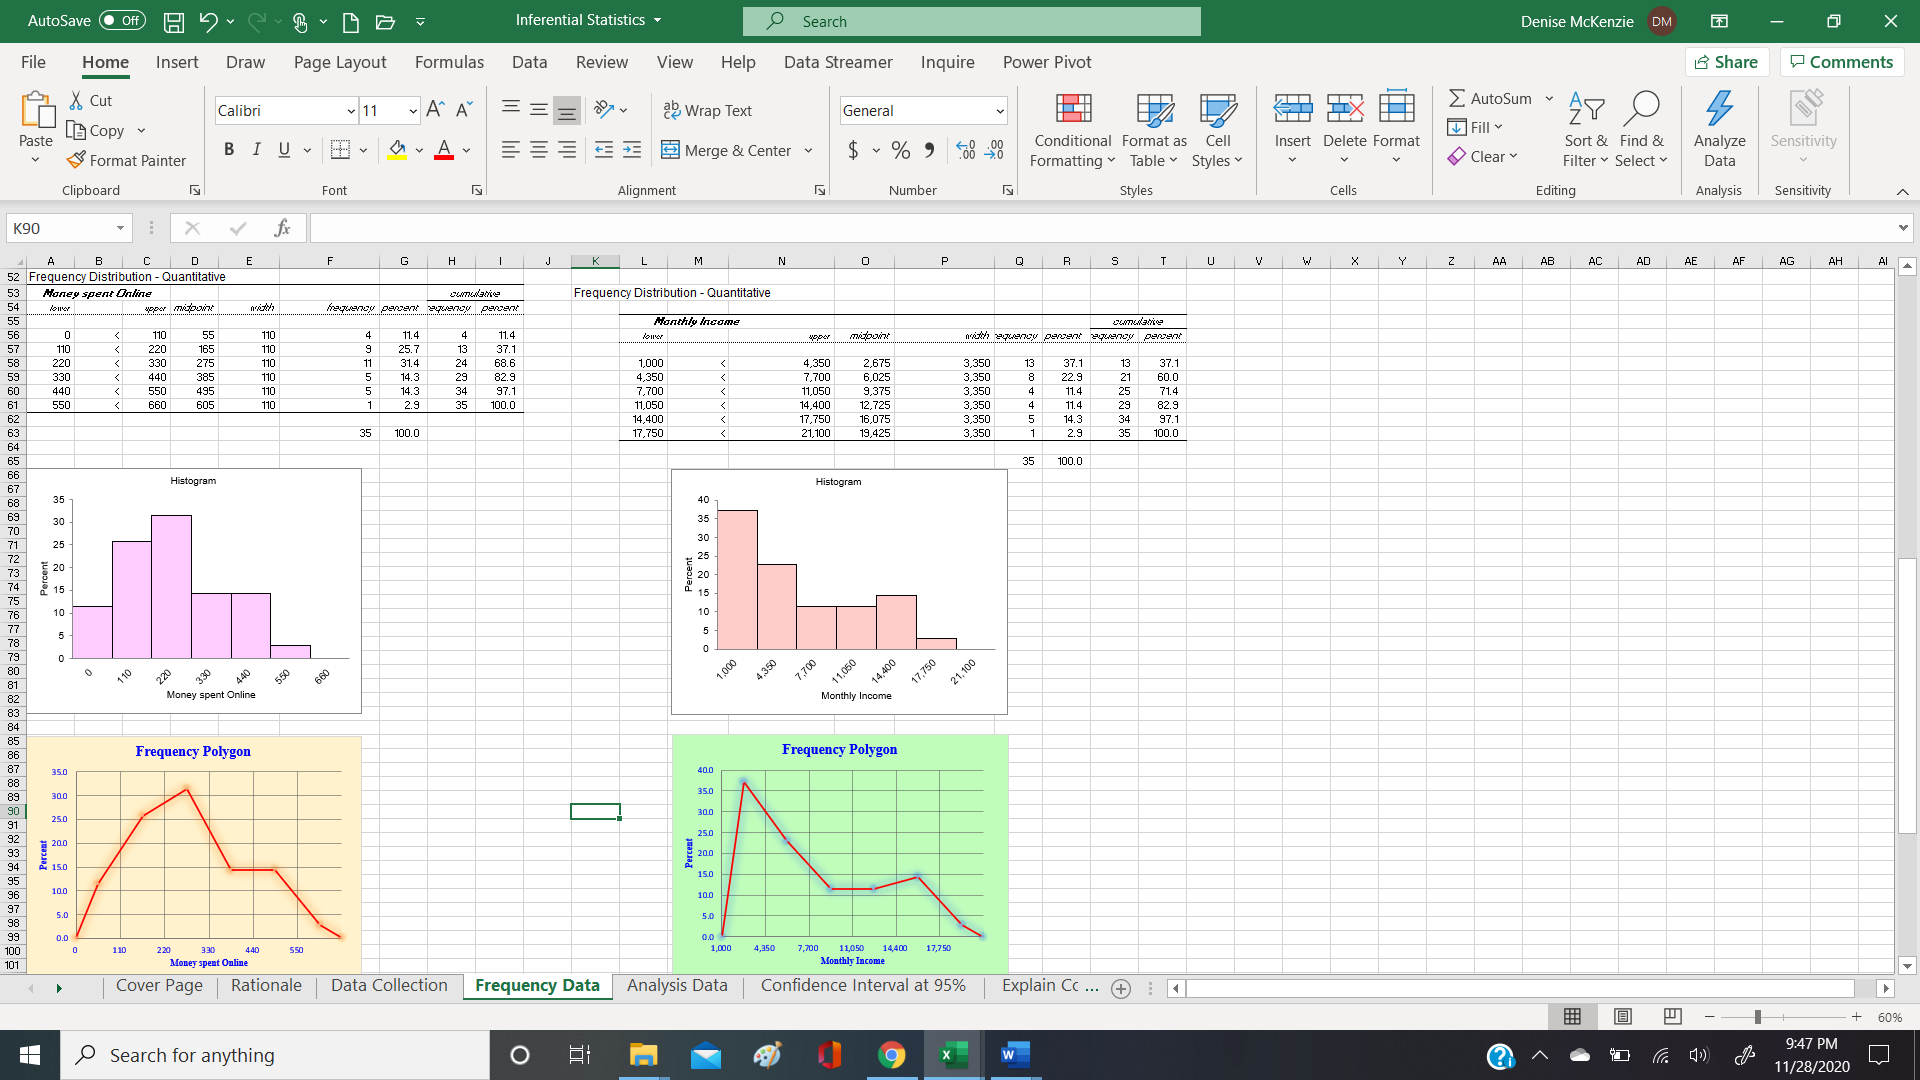
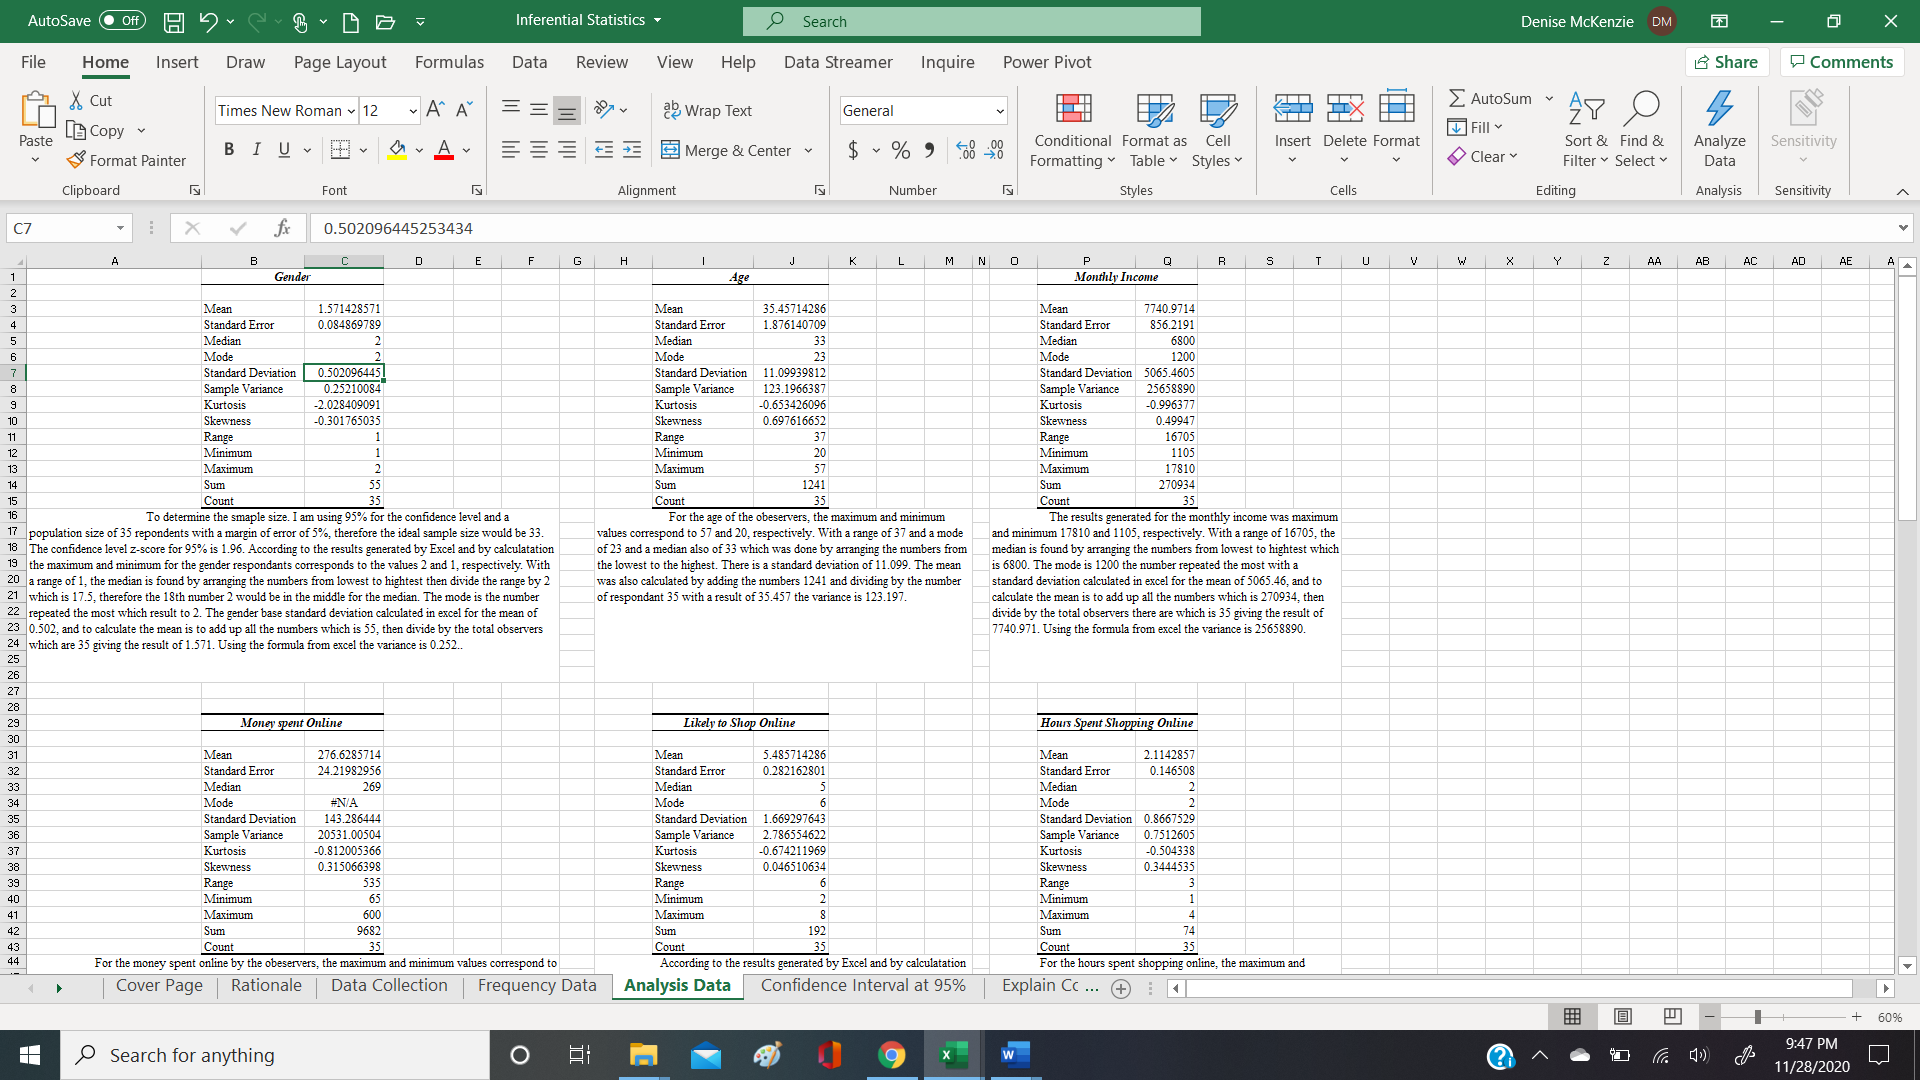
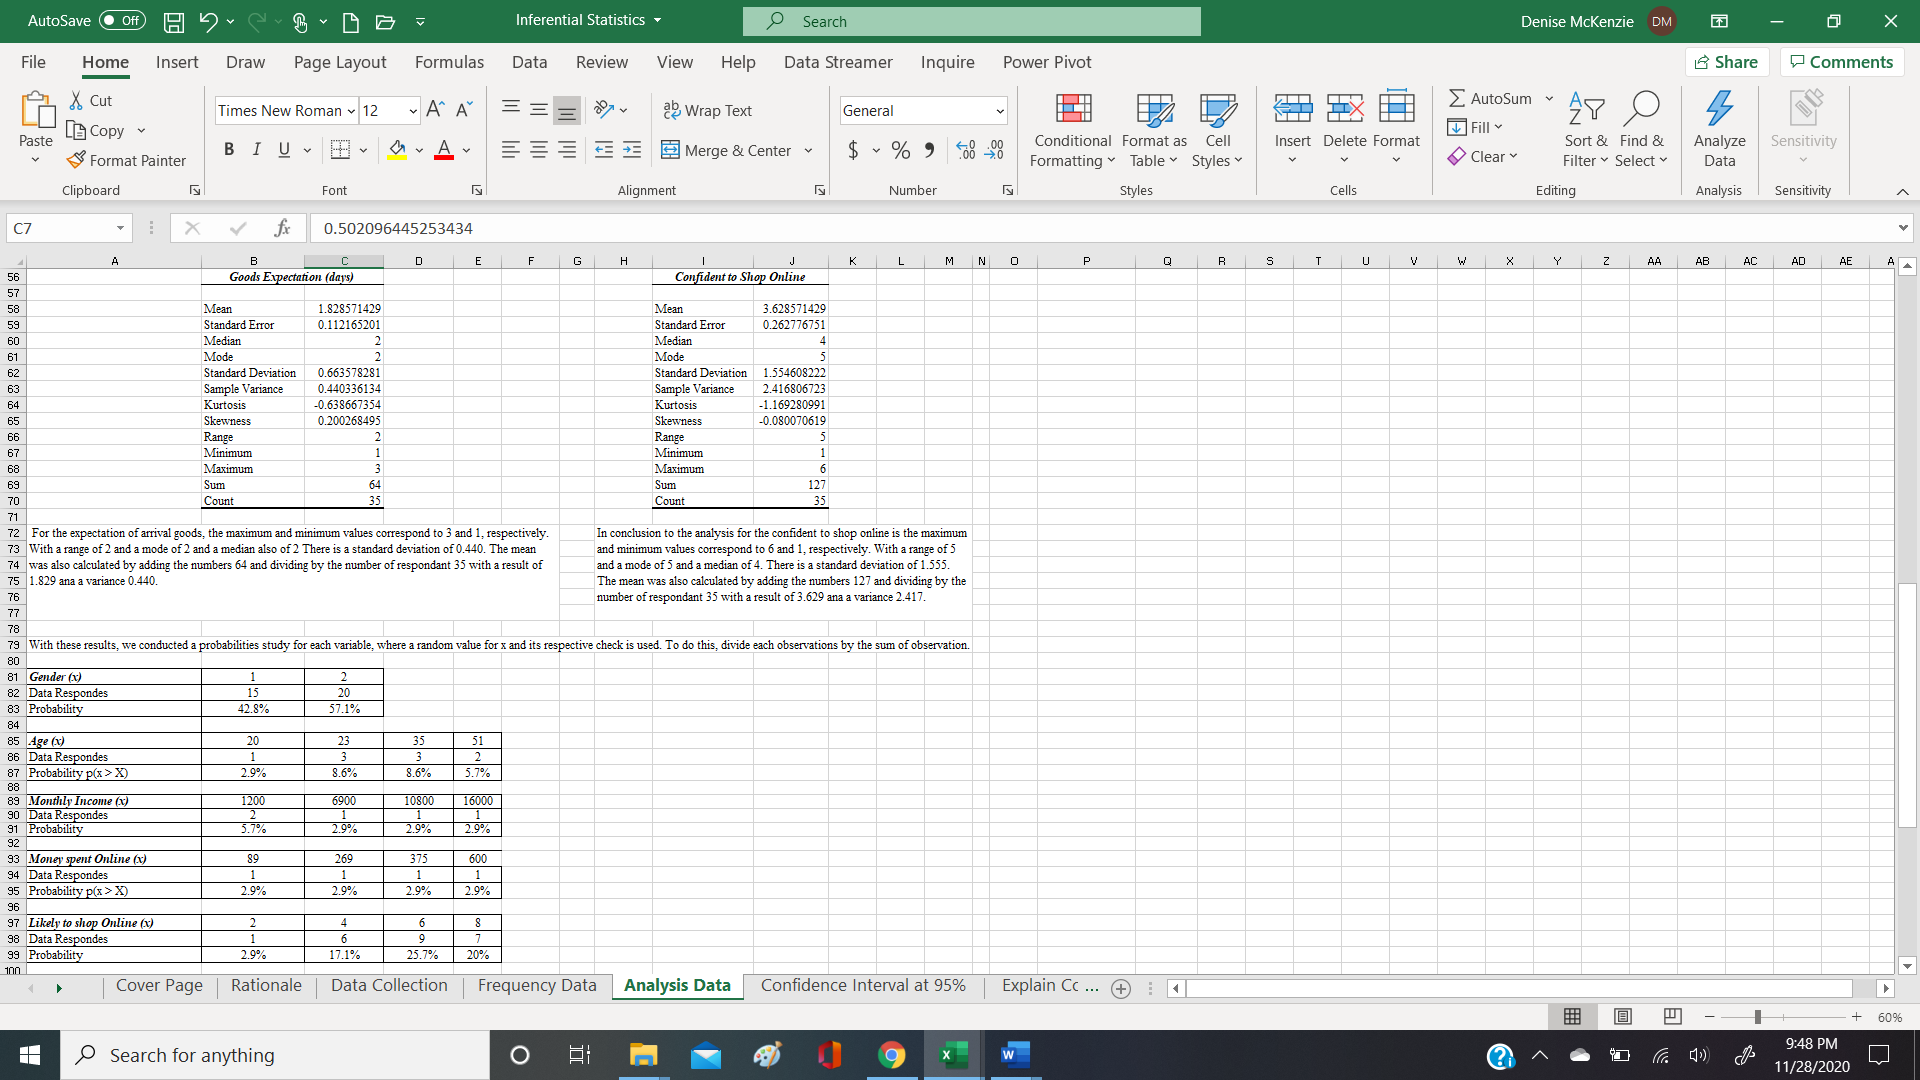
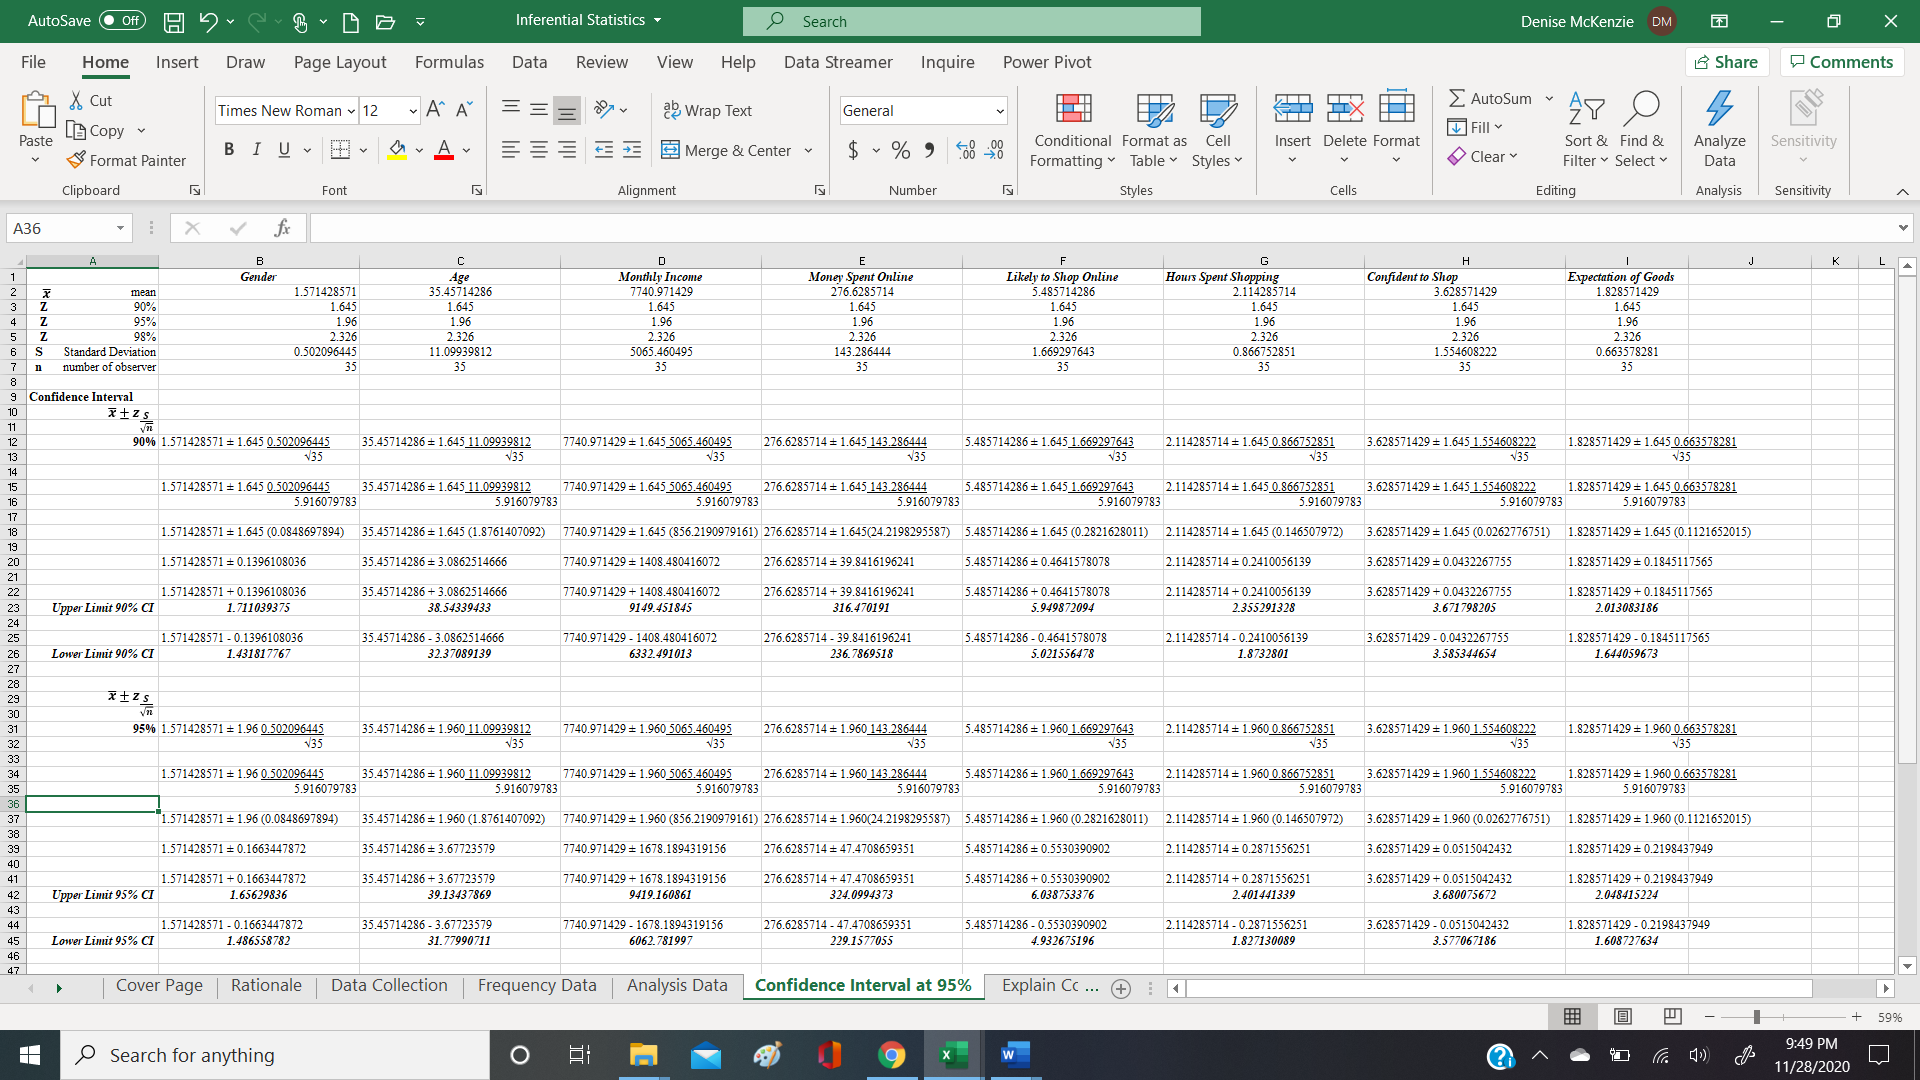
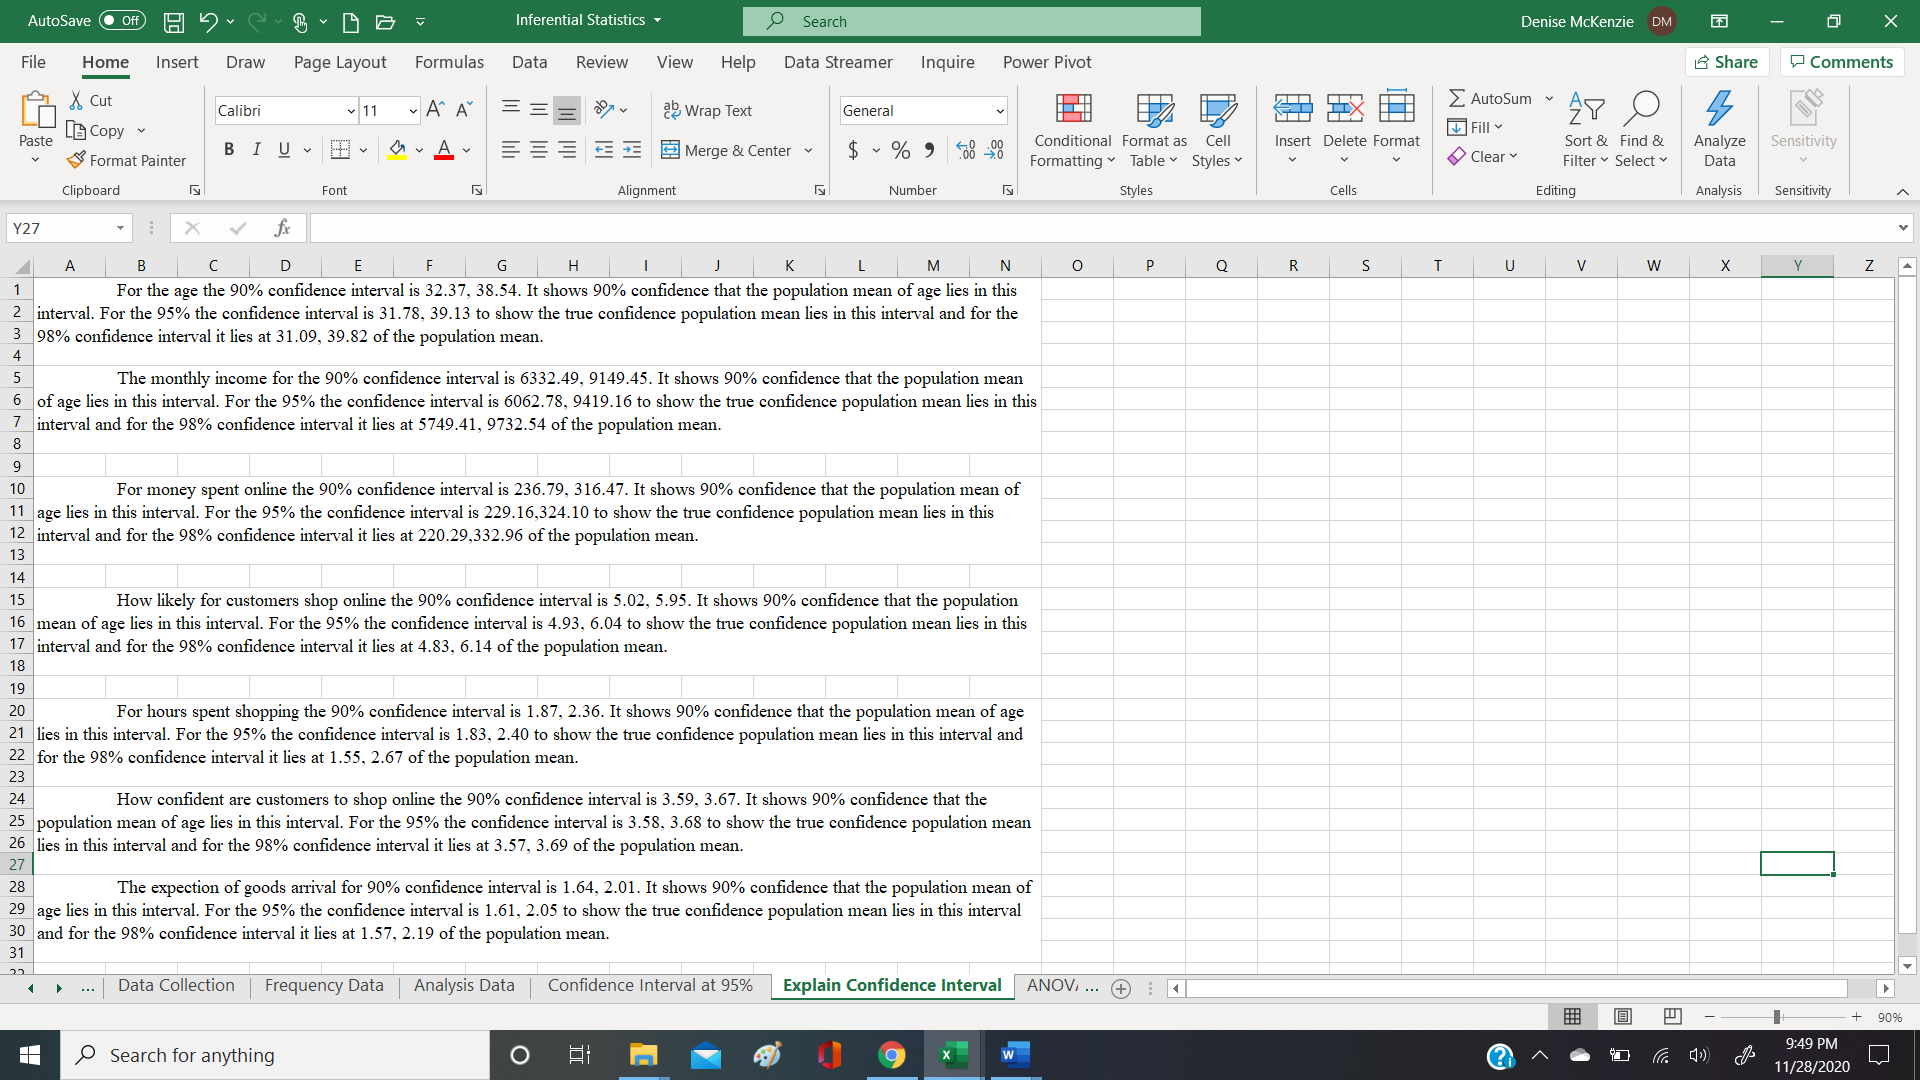
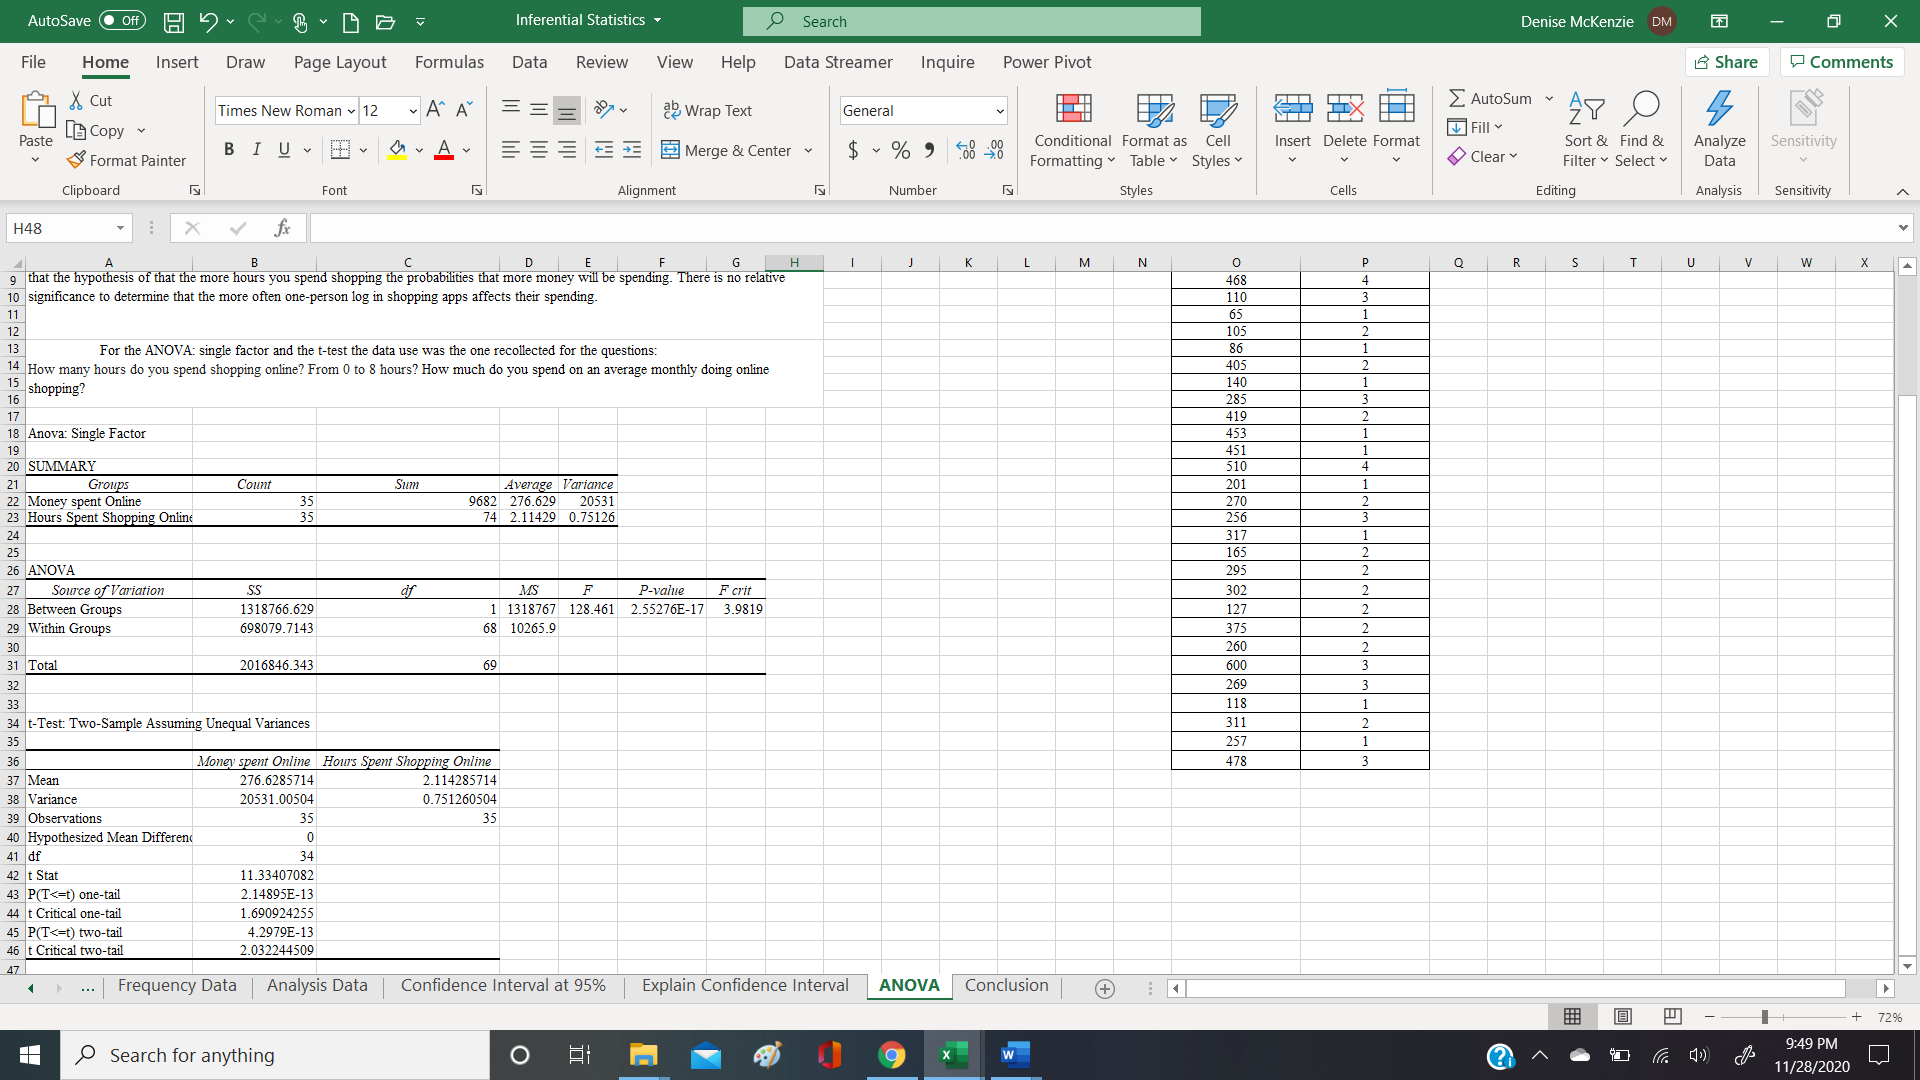
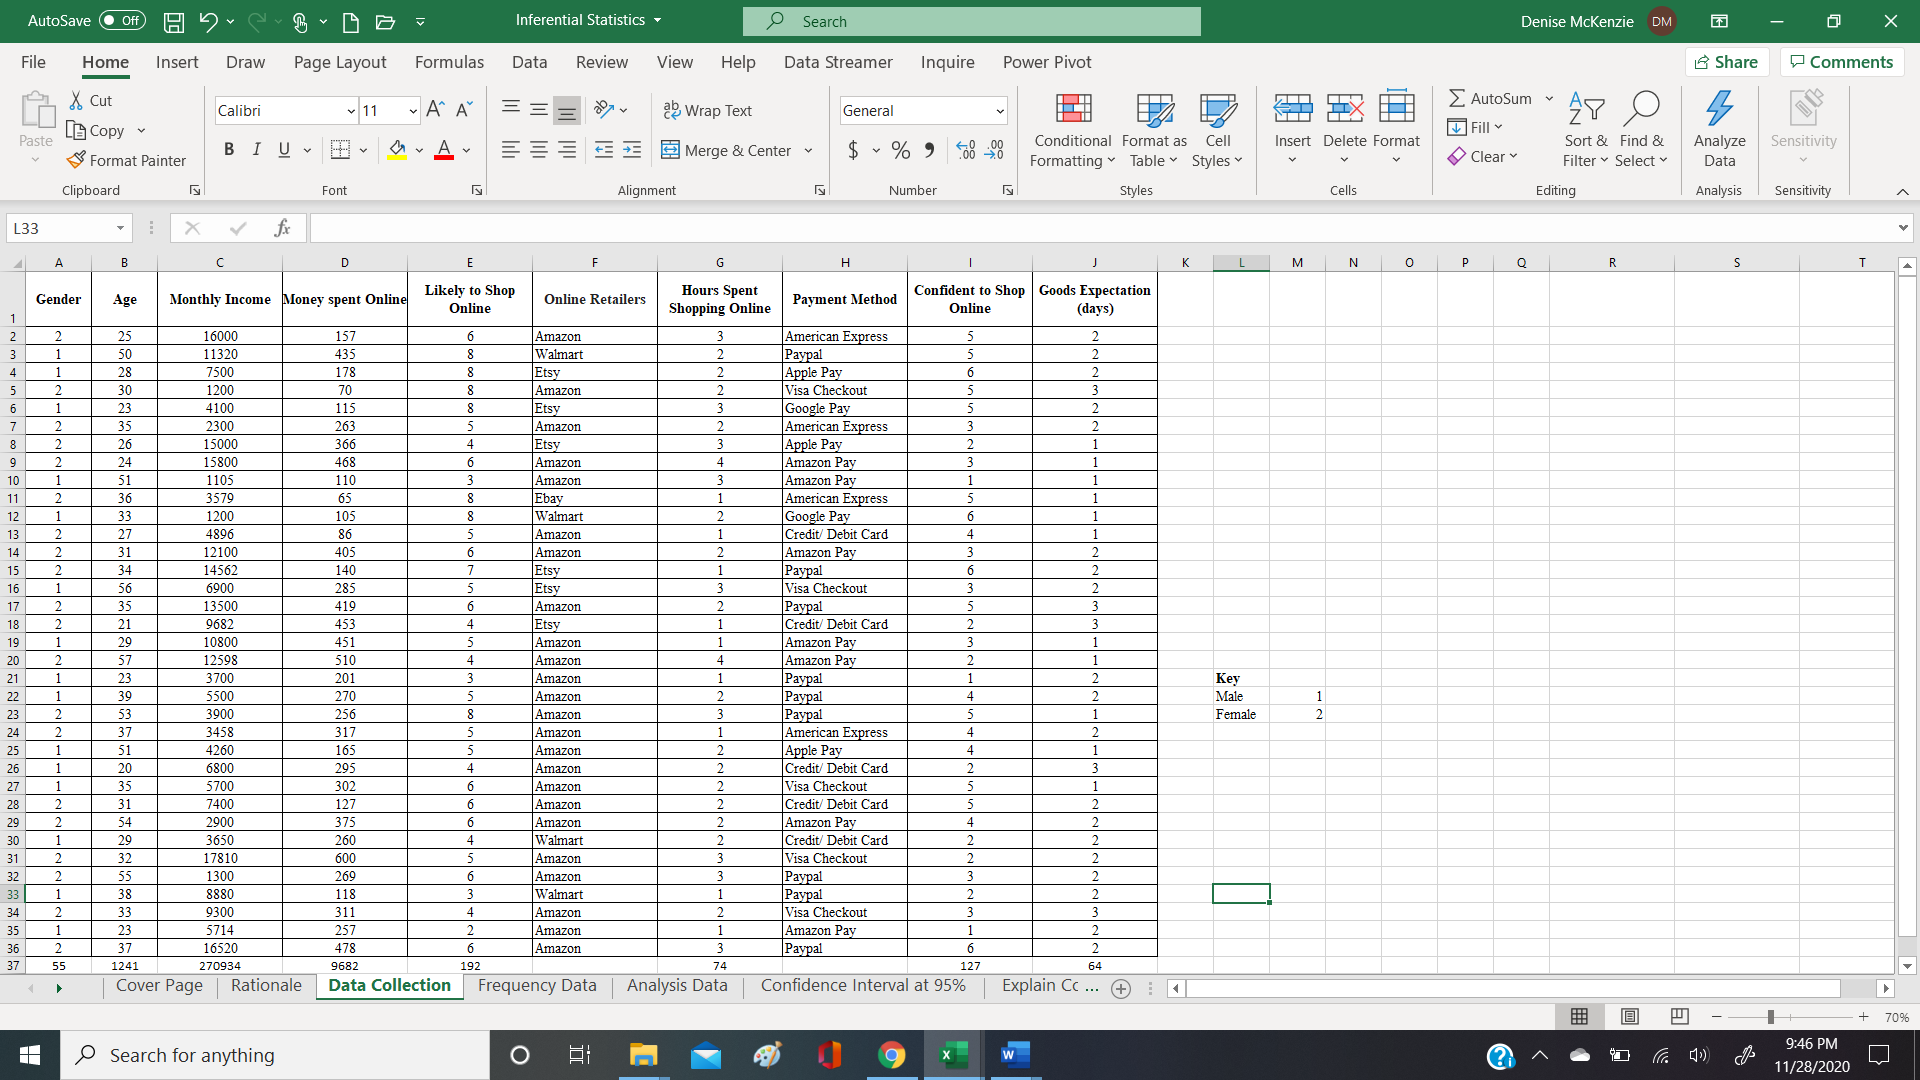
AutoSave . Off) H Inferential Statistics . Search Denise Mckenzie DM X File Home Insert Draw Page Layout Formulas Data Review View Help Data Streamer Inquire Power Pivot Share Comments X Cut AutoSum Calibri 11 A" A ae Wrap Text General [ Copy Fill Paste Conditional Format as Cell Insert Delete Format Sort & Find & Analyze Sensitivity Format Painter BIUT DAY EE E E E Merge & Center v $ ~ % 9 08 20 Formatting * Table Styles Clear Filter ~ Select Data Clipboard Font Alignment Number Styles Cells Editing Analysis Sensitivity K90 X Y fx B C D GH | I J K M N 0 Q R S T U V W X Y Z AB AC AD AE AF P AG AH Al Money spent Online Class Frequency Relative Frequency Monthly Income Class Frequency Relative Frequency 600 - 65 = 535 0 - 120 20.00% 17810 - 1105 = 16705 1000 - 4500 13 37.14% 120 - 240 17.149 4500 - 8000 25.71% 240 - 360 11 31.43% 8000 - 11500 11.43% 107 360 - 480 22.86% 3341 11500 - 15000 14.29% 480 - 600 8.57% 15000 - 18500 11.43% 35 With the information collected a bar graph and pie chart was made to present the data concerning the amount of money spent online of the participants and the monthly income of each person. MONEY SPENT ONLINE MONTHLY INCOME Customers Customers 0 -120 120 -240 240 - 360 360 - 480 480 - GOD 1000- 4500 4500-8000 8 8000-11500 11500 - 15000 15000 - 18500 Amount Spend Income Amount Frequency Frequency 209% 11% 2396 10-120 37% 1000 - 4500 120 -240 4500- 8000 1796 240 -360 12% 8000- 11500 11500 - 15000 31% - 360 - 480 2696 480 - 600 15000 - 18500 The money spent online of the participants and the monthly income were also represented with a histogram, a frequency polygons and a ogive. Cover Page | Rationale | Data Collection Frequency Data Analysis Data | Confidence Interval at 95% | Explain Cc ... + - - - + 60% 9:47 PM Search for anything O M 11/28/2020AutoSave . Off) H Inferential Statistics . Search Denise Mckenzie DM X File Home Insert Draw Page Layout Formulas Data Review View Help Data Streamer Inquire Power Pivot Share Comments & Cut Calibri 11 A" A ae Wrap Text AutoSum General Fill Paste [G Copy = = = E E Merge & Center v $ ~ % 9 08 20 Conditional Format as Cell Insert Delete Format Sort & Find & Analyze Sensitivity Format Painter Formatting Table Styles Clear Filter ~ Select Data Clipboard Font Alignment Number Styles Cells Editing Analysis Sensitivity K90 X V fx A B C D F G H I J K L M N P Q R S T U V W X Y 2 AA AB AC AD AE AF P AG AH Al Frequency Distribution - Quantitative Money spent Online Frequency Distribution - Quantitative .frequency percent aqwandy percent Monthly Income 55 11.4 165 110 275 37.1 68.6 1,000 4,350 2,675 37. 385 14 .3 82.9 3,350 4,350 7.700 6,025 3,350 37.1 22.9 60.0 495 14. 3 97.1 7,700 1.050 9 , 375 3,350 11.4 71.4 605 100.0 11,050 AAAAA 14,40 12,725 3,350 11.4 82.9 4,400 7,750 16 075 3,35 97.1 35 100.0 17,750 21,100 19,425 100.0 35 100.0 Histogram Histogram Percent O 4 350 7 700 AAP 6.60 1,050 17.750 1,100 Money spent Online Monthly Income Frequency Polygon Frequency Polygon 35.0 40.0 300 35.0 250 300 250 200 200 : 150 150 100 100 97 98 5.0 99 Do 100 Money spent Online 4,350 7,700 11,050 14,400 17,750 Monthly Income Cover Page | Rationale | Data Collection Frequency Data Analysis Data | Confidence Interval at 95% | Explain Cc ... + - - -+ 60% Search for anything O 9:47 PM 11/28/2020AutoSave . Off) H Inferential Statistics . Search Denise Mckenzie DM X File Home Insert Draw Page Layout Formulas Data Review View Help Data Streamer Inquire Power Pivot Share Comments X Cut AutoSum Times New Roman ~ 12 A" A ag Wrap Text General Fill Paste [ Copy BIUT DAY $ ~ % 9 08 20 Conditional Format as Cell Insert Delete Format Sort & Find & Analyze Sensitivity Format Painter EEE E Merge & Center Formatting * Table Styles Clear Filter ~ Select Data Clipboard Font Alignment Number Styles Cells Editing Analysis Sensitivity C7 X Y fx 0.502096445253434 A B E F G |H K L M NO P Q R ST U v W X Y AA AB AC AD AE A Gender Age Monthly Income Mean 1.571428571 Mean 35.45714286 Mean 7740.9714 Standard Error 0.084869789 Standard Error 1.876140709 Standard Error 856.2191 Median Median 33 Median 6800 Mode Mode 23 Mode 1200 Standard Deviation 0.502096445 Standard Deviation 11.09939812 Standard Deviation 5065.4605 Sample Variance 0.25210084 Sample Variance 123.1966387 Sample Variance 25658890 Kurtosis -2.028409091 Kurtosis -0.653426096 Kurtosis 0.996377 Skewness -0.301765035 Skewness 0.697616652 Skewness 0.49947 Lange Range 37 Range 16705 Minimum Minimum 20 Minimum 1105 Maximum 2 Maximum 57 Maximum 17810 Sum 55 Sum 1241 Sum 270934 Count 35 Count 35 Count To determine the smaple size. I am using 95% for the confidence level and a For the age of the obeservers, the maximum and minimum The results generated for the monthly income was maximum 17 population size of 35 repondents with a margin of error of 5%, therefore the ideal sample size would be 33 values correspond to 57 and 20, respectively. With a range of 37 and a mode and minimum 17810 and 1105, respectively. With a range of 16705, the 18 The confidence level z-score for 95% is 1.96. According to the results generated by Excel and by calculatation of 23 and a median also of 33 which was done by arranging the numbers from median is found by arranging the mbers from lowest to hightest which 19 the maximum and minimum for the gender respondants corresponds to the values 2 and 1, respectively. With the lowest to the highest. There is a standard deviation of 11.099. The mean is 6800. The mode is 1200 the number repeated the most with a a range of 1, the median is found by arranging the numbers from lowest to hightest then divide the range by 2 was also calculated by adding the numbers 1241 and dividing by the number standard deviation calculated in excel for the mean of 5065.46, and to 1 which is 17.5, therefore the 18th number 2 would be in the middle for the median. The mode is the number of respondant 35 with a result of 35.457 the variance is 123.197. calculate the mean is to add up all the numbers which is 270934, then 2 repeated the most which result to 2. The gender base standard deviation calculated in excel for the mean of divide by the total observers there are which is 35 giving the result of 23 0.502, and to calculate the mean is to add up all the numbers which is 55, then divide by the total observers 7740.971. Using the formula from excel the variance is 25658890. 4 which are 35 giving the result of 1.571. Using the formula from excel the variance is 0.252. Money spent Online Likely to Shop Online Hours Spent Shopping Online Mean 276.6285714 Mean 5.485714286 Mean 2.1142857 Standard Error 24.21982956 Standard Error 0.282162801 Standard Error 0.146508 Median 269 Median Median Mode #N/A Mode Mode Standard Deviation 143.286444 Standard Deviation 1.669297643 Standard Deviation 0.8667529 Sample Variance 20531.00504 Sample Variance 2.786554622 Sample Variance 0.7512605 Kurtosis -0.812005366 Kurtosis -0.674211969 Kurtosis -0.504338 Skewness 0.315066398 Skewness 0.046510634 Skewness 0.3444535 Range 535 Range Range Minimum 65 Minimum Minimum Maximum 600 Maximum Maximum Sum 682 Sum 192 Sum Count 35 Count 35 Count 35 For the money spent online by the obeservers, the maximum and minimum values correspond to According to the results generated by Excel and by calculatation For the hours spent shopping online, the maximum and Cover Page | Rationale Data Collection | Frequency Data Analysis Data Confidence Interval at 95% Explain Cc ... + - + 60% 9:47 PM Search for anything O M 11/28/2020AutoSave . Off) H Inferential Statistics . Search Denise Mckenzie DM X File Home Insert Draw Page Layout Formulas Data Review View Help Data Streamer Inquire Power Pivot Share Comments X Cut Times New Roman ~ 12 A" A ap Wrap Text AutoSum General Fill Paste [ Copy Format Painter EEE E Merge & Center v $ ~ % 9 08 20 Conditional Format as Cell Insert Delete Format Sort & Find & Analyze Sensitivity Formatting Table ~ Styles Clear Filter ~ Select Data Clipboard Font Alignment Number Styles Cells Editing Analysis Sensitivity C7 X fix 0.502096445253434 A B E F G H K L M NO P Q R S T U V W X Y 2 AA AB AC AD AE A Goods Expectation (days) Confident to Shop Online Mean 1.828571429 Mean 3.628571429 Standard Error 0.112165201 Standard Error 0.262776751 Median Median Mode Mode 62 Standard Deviation 0.663578281 Standard Deviation 1.554608222 Sample Variance 0.440336134 Sample Variance 2.416806723 Kurtosis 0.638667354 Kurtosis -1.169280991 Skewness 0.200268495 Skewness -0.080070619 Range Range Minimum Minimum Maximum Maximum Sum Sum 127 Count Count 72 For the expectation of arrival goods, the maximum and minimum values correspond to 3 and 1, respectively. In conclusion to the analysis for the confident to shop online is the maximum 73 With a range of 2 and a mode of 2 and a median also of 2 There is a standard deviation of 0.440. The mean mum values correspond to 6 and 1, respectively. With a range of 5 74 was also calculated by adding the numbers 64 and dividing by the number of respondant 35 with a result of and a mode of 5 and a median of 4. There is a standard deviation of 1.555. 75 1.829 ana a variance 0.440. The mean was also calculated by adding the numbers 127 and dividing by the 76 number of respondant 35 with a result of 3.629 ana a variance 2.417. 77 78 79 With these results, we conducted a probabilities study for each variable, where a random value for x and its respective check is used. To do this, divide each observations by the sum of observation. 80 81 Gender (x) 82 Data Respondes 15 20 83 42.8% 57.1% 84 85 Age (x) 20 23 35 51 36 Data Respondes 1 3 3 2 87 Probability p(x > X) 2.9%% 8.6% 8.6% 5.7% 88 89 Monthly Income (x) 1200 6900 10800 16000 90 Data Respondes 91 Probability 3.7% 2.9% 2.9% 2.9% 92 93 Money spent Online (x) 89 269 1 375 1 600 34 Data Respondes 15 Probability p(x > X) 2.9% 2.9% 2.9 % 2.9% 96 97 Likely to shop Online (x) 98 I 6 99 Probability 9% 17.1% 25.7%% 20% 100 Cover Page | Rationale | Data Collection | Frequency Data Analysis Data Confidence Interval at 95% | Explain Cc ... + - - - + 60% Search for anything O M 9:48 PM 11/28/2020AutoSave . Off) H Inferential Statistics * Search Denise Mckenzie DM X File Home Insert Draw Page Layout Formulas Data Review View Help Data Streamer Inquire Power Pivot Share Comments X Cut Times New Roman ~ 12 A" A ap Wrap Text AutoSum General AY O Paste [ Copy Fill BIU DAY $ ~ % 9 08 20 Conditional Format as Cell Insert Delete Format Sort & Find & Sensitivity Format Painter EE E E Merge & Center v Analyze Formatting > Table Styles Clear Filter * Select Data Clipboard Font Alignment Number Styles Cells Editing Analysis Sensitivity A36 X Y fix A B C D E F G K ender Age Monthly Income Money Spent Online Likely to Shop Online Hours Spent Shopping Confident to Shop Expectation of Goods mean 1.571428571 $5.45714286 7740.971429 276.6285714 5.485714286 2.114285714 3.628571429 1.828571429 90% 1.645 1.645 1.645 1.645 1.645 1.645 1.645 1.645 95% 1.96 1.96 1.96 1.96 1.96 1.96 1.96 1.96 FUNNNA 98% 2.326 2.326 2.326 2.326 2.326 2.326 2.326 2.326 Standard Deviation 0.502096445 11.09939812 065.460495 43.286444 1.669297643 0.866752851 1.554608222 .663578281 number of observer 35 35 35 35 35 35 35 35 Confidence Interval x+zs 90% 1.571428571 = 1.645 0.502096445 35.45714286 + 1.645 11.09939812 7740.971429 = 1.645 5065.460495 276.6285714 + 1.645 143.286444 5.485714286 = 1.645 1.669297643 2.114285714 = 1.645 0.866752851 3.628571429 + 1.645 1.554608222 1.828571429 = 1.645 0.663578281 V35 V35 V35 V35 V35 V35 V35 V35 1.571428571 = 1.645 0.502096445 35.45714286 + 1.645 11.09939812 7740.971429 = 1.645 5065.460495 276.6285714 + 1.645 143.286444 5.485714286 = 1.645 1.669297643 2.114285714 = 1.645 0.866752851 3.628571429 + 1.645 1.554608222 1.828571429 = 1.645 0.663578281 5.916079783 5.916079783 5.916079783 5.91607978 5.916079783 5.916079783 5.916079783 5.916079783 1.571428571 = 1.645 (0.0848697894) 35.45714286 + 1.645 (1.8761407092) 7740.971429 + 1.645 (856.2190979161) 276.6285714 + 1.645(24.2198295587) 5.485714286 + 1.645 (0.2821628011) 2.114285714 # 1.645 (0.146507972) 3.628571429 = 1.645 (0.0262776751) 1.828571429 + 1.645 (0.1121652015) 1.571428571 = 0.1396108036 35.45714286 + 3.0862514666 740.971429 = 1408.480416072 276.6285714 + 39.8416196241 5.485714286 + 0.4641578078 2.114285714 + 0.2410056139 3.628571429 + 0.0432267755 1.828571429 = 0.1845117565 1.571428571 +0.1396108036 35.45714286 + 3.086251466 7740.971429 + 1408.480416072 276.6285714 + 39.8416196241 .485714286 + 0.4641578078 2.114285714 + 0.2410056139 3.628571429 + 0.043226775 1.828571429 + 0.1845117565 Upper Limit 90% CI 1.711039375 38.54339433 9149.451845 316.470191 5.949872094 2.355291328 3.671798205 2.013083186 1.571428571 - 0.1396108036 35.45714286 - 3.0862514666 7740.971429 - 1408.480416072 276.6285714 - 39.8416196241 5.485714286 - 0.4641578078 2.114285714 - 0.2410056139 3.628571429 - 0.0432267755 1.828571429 - 0.1845117565 Lower Limit 90% CI 1.431817767 32.37089139 6332.491013 236. 7869518 5.021556478 1.8732801 3.585344654 1.644059673 xtzs 95% 1.571428571 = 1.96 0.502096445 35.45714286 + 1.960 11.09939812 7740.971429 + 1.960 5065.460495 276.6285714 + 1.960 143.286444 5.485714286 + 1.960 1.669297643 2.114285714 = 1.960 0.866752851 3.628571429 = 1.960 1.554608222 1.828571429 = 1.960 0.663578281 V35 V35 V35 135 V35 V35 V35 1.571428571 = 1.96 0.502096445 35.45714286 + 1.960 11.09939812 7740.971429 = 1.960 5065.460495 276.6285714 = 1.960 143.286444 5.485714286 = 1.960 1.669297643 2.114285714 + 1.960 0.866752851 3.628571429 = 1.960 1.554608222 1.828571429 = 1.960 0.663578281 5.916079783 5.916079783 5.916079783 5.916079783 5.916079783 5.916079783 5.916079783 5.916079783 37 1.571428571 = 1.96 (0.0848697894) 35.45714286 + 1.960 (1.8761407092) 7740.971429 + 1.960 (856.2190979161) 276.6285714 = 1.960(24.2198295587) 5.485714286 = 1.960 (0.2821628011) 2.114285714 = 1.960 (0.146507972) 3.628571429 = 1.960 (0.0262776751) 1.828571429 = 1.960 (0.1121652015) 1.571428571 = 0.1663447872 35.45714286 + 3.67723579 7740.971429 = 1678.1894319156 276.6285714 + 47.4708659351 5.485714286 + 0.5530390902 2.114285714 = 0.2871556251 3.628571429 + 0.0515042432 1.828571429 = 0.2198437949 1.571428571 + 0.1663447872 35.45714286 + 3.67723579 7740.971429 + 1678.1894319156 276.6285714 + 47.470865935 5.485714286 + 0.5530390902 2.114285714 + 0.2871556251 3.628571429 + 0.0515042432 1.828571429 + 0.2198437949 Upper Limit 95% CI 1.65629836 39.13437869 9419.160861 324.0994373 6.038753376 2.401441339 3.680075672 2.048415224 1.571428571 - 0.1663447872 35.45714286 - 3.67723579 7740.971429 - 1678.1894319156 276.6285714 - 47.4708659351 5.485714286 - 0.5530390902 2.114285714 - 0.2871556251 3.628571429 - 0.0515042432 1.828571429 - 0.2198437949 Lower Limit 95% CI 1.486558782 31.77990711 6062.781997 229.1577055 4.932675196 1.827130089 3.577067186 1.608727634 Cover Page | Rationale | Data Collection | Frequency Data | Analysis Data Confidence Interval at 95% Explain Cc ... + - + 59% Search for anything O M 9 9:49 PM ?1 11/28/2020AutoSave . Off) H Inferential Statistics . Search Denise Mckenzie DM X File Home Insert Draw Page Layout Formulas Data Review View Help Data Streamer Inquire Power Pivot Share Comments X Cut Calibri 11 ~ A" A ap Wrap Text AutoSum General [ Copy Fill AY O Paste BIUVA ~ EEE E Merge & Center v $ ~ % 9 00 20 Conditional Format as Cell Insert Delete Format Sort & Find & Analyze Sensitivity Format Painter Formatting > Table Styles Clear Filter ~ Select Data Clipboard Font Alignment Number Styles Cells Editing Analysis Sensitivity Y27 X V fx A B C D E F G H I J K L M N O P Q R S T U V W X Y Z For the age the 90% confidence interval is 32.37, 38.54. It shows 90% confidence that the population mean of age lies in this 2 interval. For the 95% the confidence interval is 31.78, 39.13 to show the true confidence population mean lies in this interval and for the 3 98% confidence interval it lies at 31.09, 39.82 of the population mean. The monthly income for the 90% confidence interval is 6332.49, 9149.45. It shows 90% confidence that the population mean of age lies in this interval. For the 95% the confidence interval is 6062.78, 9419.16 to show the true confidence population mean lies in this interval and for the 98% confidence interval it lies at 5749.41, 9732.54 of the population mean. 10 For money spent online the 90% confidence interval is 236.79, 316.47. It shows 90% confidence that the population mean of 11 age lies in this interval. For the 95% the confidence interval is 229.16,324.10 to show the true confidence population mean lies in this 12 interval and for the 98% confidence interval it lies at 220.29,332.96 of the population mean. 13 14 15 How likely for customers shop online the 90% confidence interval is 5.02, 5.95. It shows 90% confidence that the population mean of age lies in this interval. For the 95% the confidence interval is 4.93, 6.04 to show the true confidence population mean lies in this 17 interval and for the 98% confidence interval it lies at 4.83, 6.14 of the population mean. 18 19 20 For hours spent shopping the 90% confidence interval is 1.87, 2.36. It shows 90% confidence that the population mean of age 21 lies in this interval. For the 95% the confidence interval is 1.83, 2.40 to show the true confidence population mean lies in this interval and 22 for the 98% confidence interval it lies at 1.55, 2.67 of the population mean. 23 24 How confident are customers to shop online the 90% confidence interval is 3.59, 3.67. It shows 90% confidence that the 25 population mean of age lies in this interval. For the 95% the confidence interval is 3.58, 3.68 to show the true confidence population mean 26 lies in this interval and for the 98% confidence interval it lies at 3.57, 3.69 of the population mean. 28 The expection of goods arrival for 90% confidence interval is 1.64, 2.01. It shows 90% confidence that the population mean of 29 age lies in this interval. For the 95% the confidence interval is 1.61, 2.05 to show the true confidence population mean lies in this interval 30 and for the 98% confidence interval it lies at 1.57, 2.19 of the population mean. 31 22 ... Data Collection |Frequency Data | Analysis Data | Confidence Interval at 95% Explain Confidence Interval ANOV, ... + D - + 90% Search for anything O 9:49 PM 11/28/2020AutoSave . Off) H Inferential Statistics * Search Denise Mckenzie DM X File Home Insert Draw Page Layout Formulas Data Review View Help Data Streamer Inquire Power Pivot Share Comments & Cut Times New Roman ~ 12 ~ A" A ap Wrap Text AutoSum General AY O Paste [ Copy Fill BIU DAY EE E E Merge & Center v $ ~ % 9 00 20 Conditional Format as Cell Insert Delete Format Sort & Find & Analyze Sensitivity Format Painter Formatting * Table Styles Clear Filter ~ Select Data Clipboard Font Alignment Number Styles Cells Editing Analysis Sensitivity H48 X Y B D E F G H K L M N 0 Q R S T U V W X 9 that the hypothesis of that the more hours you spend shopping the probabilities that more money will be spending. There is no relative 468 10 significance to determine that the more often one-person log in shopping apps affects their spending. 110 11 12 13 For the ANOVA: single factor and the t-test the data use was the one recollected for the questions 14 How many hours do you spend shopping online? From 0 to 8 hours? How much do you spend on an average monthly doing online 405 13 shopping? 16 17 18 Anova: Single Factor 19 20 SUMMARY 21 Groups Count Sum Average Variance 2 Money spent Online 35 9682 276.629 20531 W H N - I W N N N N N N - W N - + - - N W - N - N - W + O 23 Hours Spent Shopping Onlin 74 2.11429 0.75126 26 ANOVA 27 Source of Variation SS df MS F P-value F crit 28 Between Groups 1318766.629 1 1318767 128.461 2.55276E-17 3.9819 9 Within Group 698079.7143 68 10265.9 30 31 Total 2016846.343 69 32 33 34 t-Test: Two-Sample Assuming Unequal Variances 35 36 Money spent Online Hours Spent Shopping Online 37 Mean 276.6285714 2.114285714 38 Variance 20531.00504 0.751260504 39 Observations 35 35 40 Hypothesized Mean Different 41 df 34 42 t Stat 11.33407082 43 P(T
