hi
attached is my project i supposed to complete any idea or reference on it?
thanks
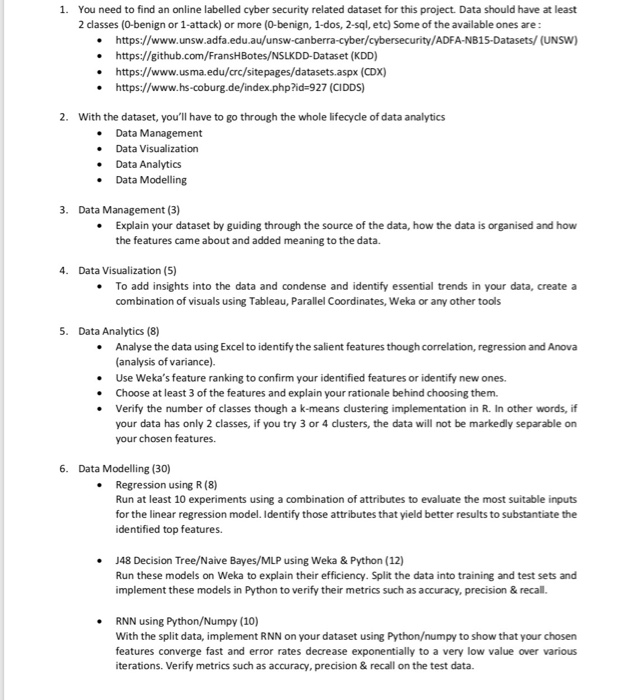
1. You need to find an online labelled cyber security related dataset for this project. Data should have at least 2 classes (0-benign or 1-attack) or more (0-benign, 1-dos, 2-sql, etc) Some of the available ones are .https://www.unsw.adfa.edu.au/unsw-canberra-cyber/cybersecurity/ADFA-NB15-Datasets/ (UNSW) https://github.com/FransHBotes/NSLKDD-Dataset (KDD) https://www.usma.edu/crc/sitepages/datasets.aspx (CDX) .https://www.hs-coburg.de/index.php?id-927 (CIDDS) 2. With the dataset, you'll have to go through the whole lifecycle of data analytics .Data Management e Data Visualization Data Analytics Data Modelling 3. Data Management (3) Explain your dataset by guiding through the source of the data, how the data is organised and how the features came about and added meaning to the data. 4. Data Visualization (5) To add insights into the data and condense and identify essential trends in your data, create a combination of visuals using Tableau, Parallel Coordinates, Weka or any other tools . S. Data Analytics (8) Analyse the data using Excel to identify the salient features though correlation, regression and Anova (analysis of variance). Use Weka's feature ranking to confirm your identified features or identify new ones. Choose at least 3 of the features and explain your rationale behind choosing them. Verify the number of classes though a k-means dustering implementation in R. In other words, if your data has only 2 classes, if you try 3 or 4 dusters, the data will not be markedly separable on your chosen features. 6. Data Modelling (30) Regression using R (8) Run at least 10 experiments using a combination of attributes to evaluate the most suitable inputs for the linear regression model. Identify those attributes that yield better results to substantiate the identified top features. J48 Decision Tree/Naive Bayes/MLP using weka & Python (12) Run these models on Weka to explain their efficiency. Split the data into training and test sets and implement these models in Python to verify their metrics such as accuracy, precision & recal. * RNN using Python/Numpy (10) With the split data, implement RNN on your dataset using Pythonumpy to show that your chosen features converge fast and error rates decrease exponentially to a very low value over various iterations. Verify metrics such as accuracy, precision & recall on the test data. 1. You need to find an online labelled cyber security related dataset for this project. Data should have at least 2 classes (0-benign or 1-attack) or more (0-benign, 1-dos, 2-sql, etc) Some of the available ones are .https://www.unsw.adfa.edu.au/unsw-canberra-cyber/cybersecurity/ADFA-NB15-Datasets/ (UNSW) https://github.com/FransHBotes/NSLKDD-Dataset (KDD) https://www.usma.edu/crc/sitepages/datasets.aspx (CDX) .https://www.hs-coburg.de/index.php?id-927 (CIDDS) 2. With the dataset, you'll have to go through the whole lifecycle of data analytics .Data Management e Data Visualization Data Analytics Data Modelling 3. Data Management (3) Explain your dataset by guiding through the source of the data, how the data is organised and how the features came about and added meaning to the data. 4. Data Visualization (5) To add insights into the data and condense and identify essential trends in your data, create a combination of visuals using Tableau, Parallel Coordinates, Weka or any other tools . S. Data Analytics (8) Analyse the data using Excel to identify the salient features though correlation, regression and Anova (analysis of variance). Use Weka's feature ranking to confirm your identified features or identify new ones. Choose at least 3 of the features and explain your rationale behind choosing them. Verify the number of classes though a k-means dustering implementation in R. In other words, if your data has only 2 classes, if you try 3 or 4 dusters, the data will not be markedly separable on your chosen features. 6. Data Modelling (30) Regression using R (8) Run at least 10 experiments using a combination of attributes to evaluate the most suitable inputs for the linear regression model. Identify those attributes that yield better results to substantiate the identified top features. J48 Decision Tree/Naive Bayes/MLP using weka & Python (12) Run these models on Weka to explain their efficiency. Split the data into training and test sets and implement these models in Python to verify their metrics such as accuracy, precision & recal. * RNN using Python/Numpy (10) With the split data, implement RNN on your dataset using Pythonumpy to show that your chosen features converge fast and error rates decrease exponentially to a very low value over various iterations. Verify metrics such as accuracy, precision & recall on the test data