Hi, can someone help me with these questions?
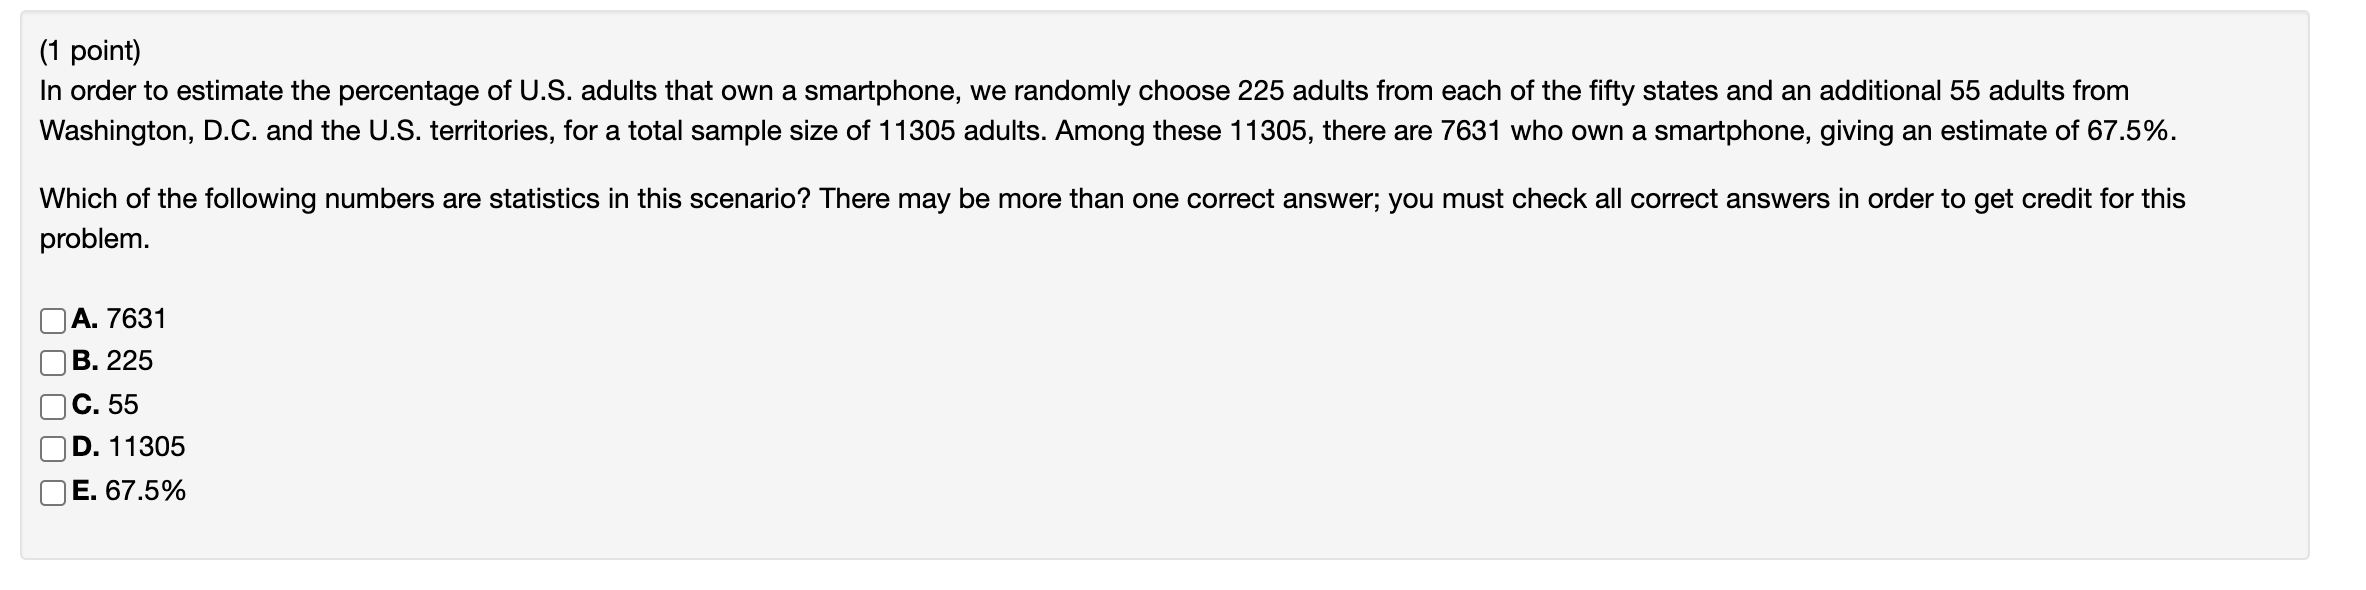
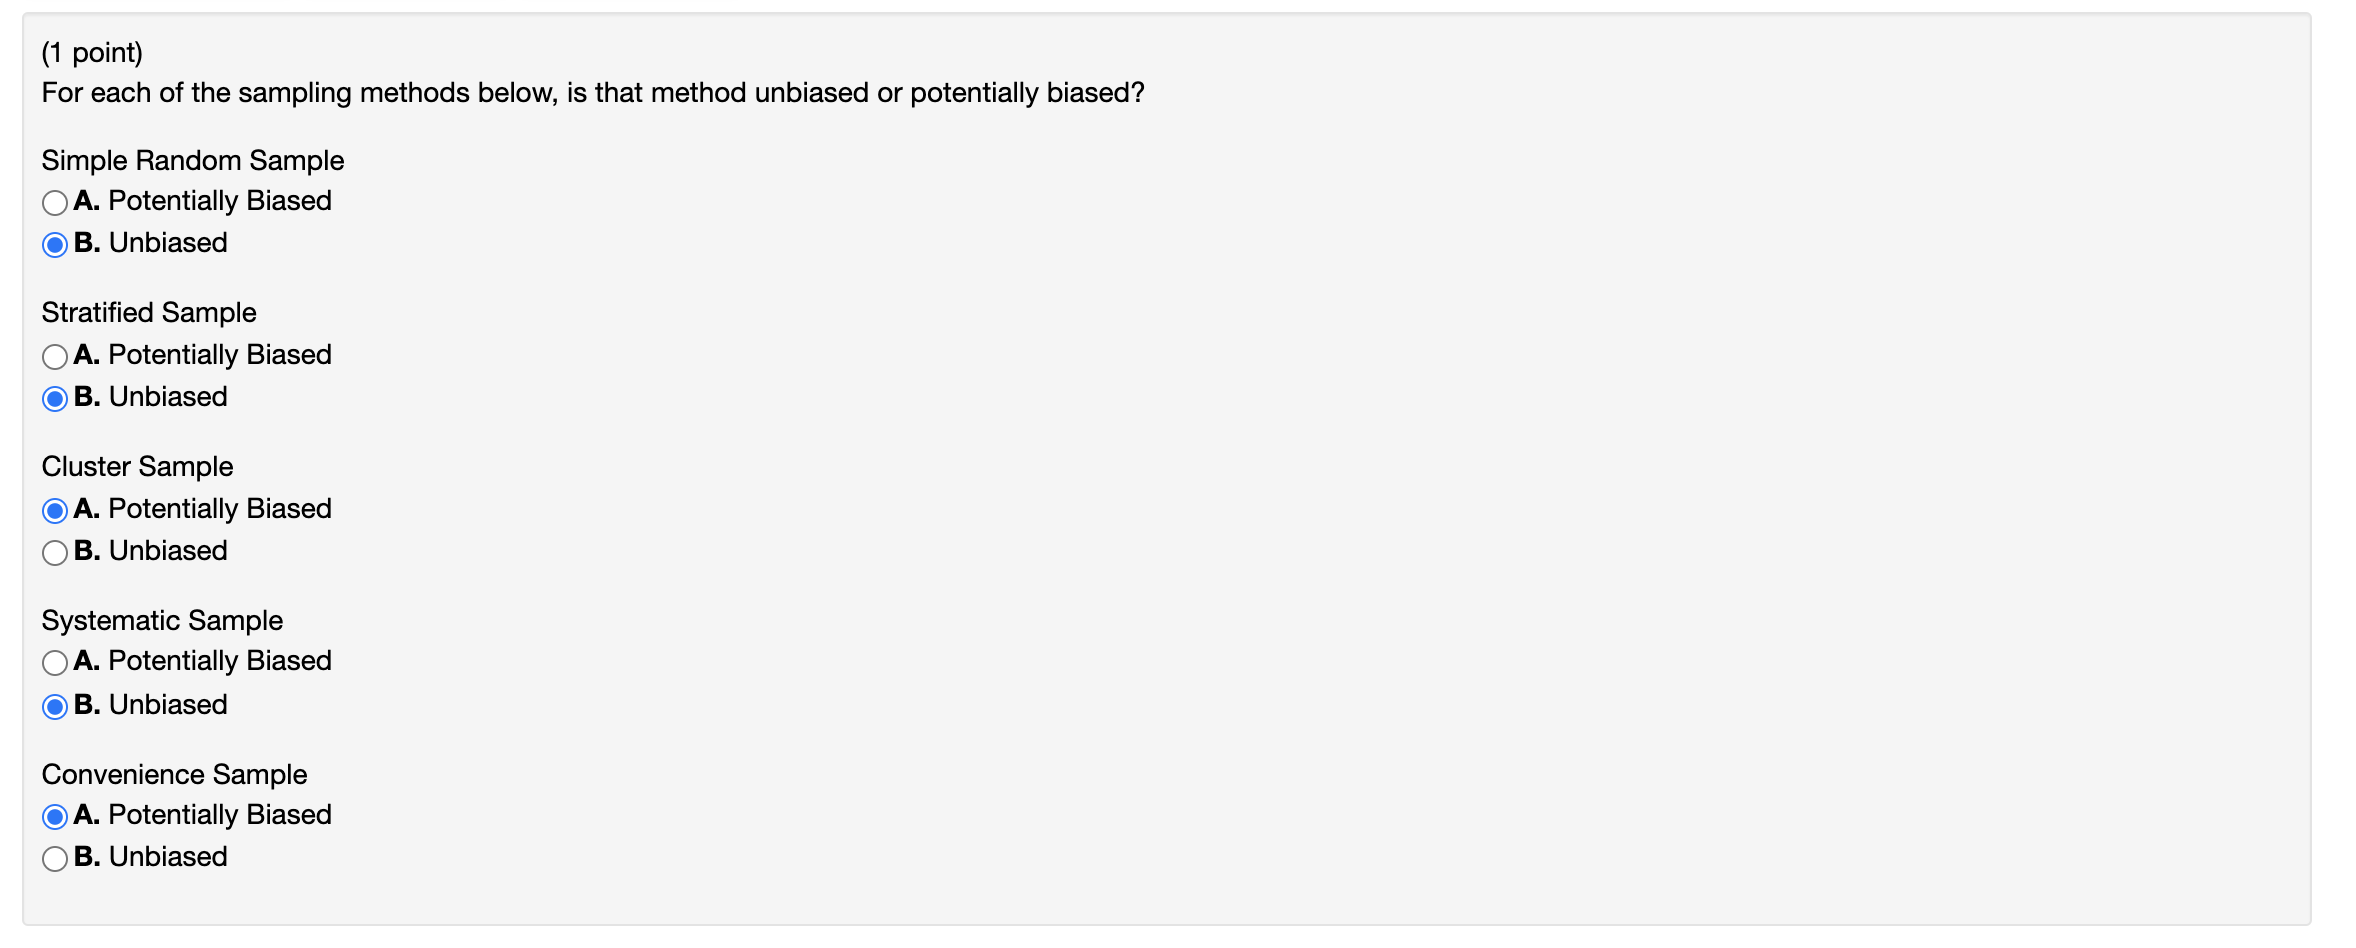
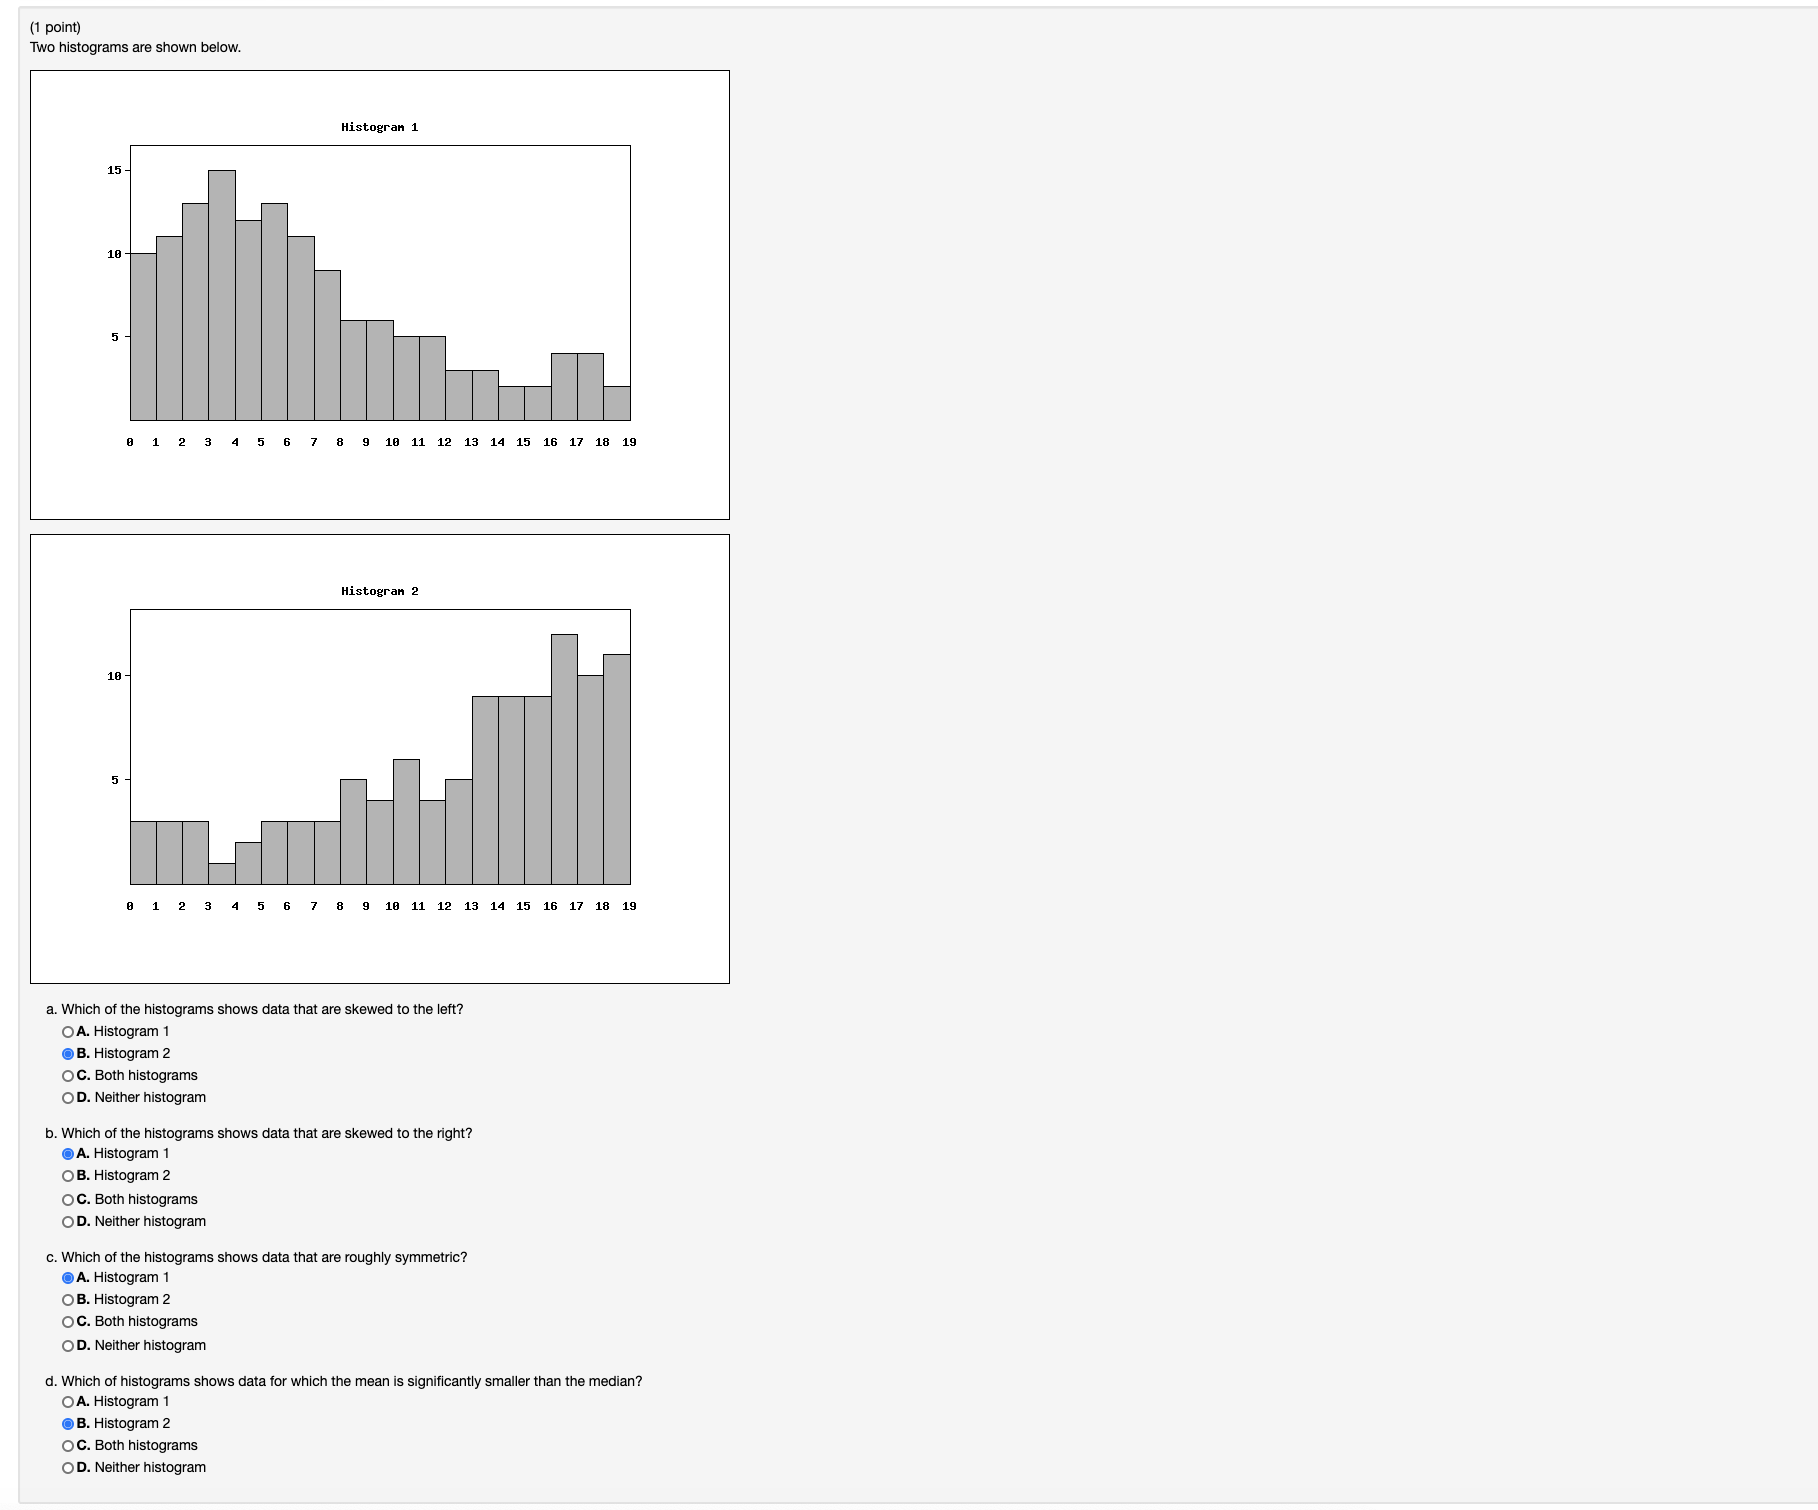
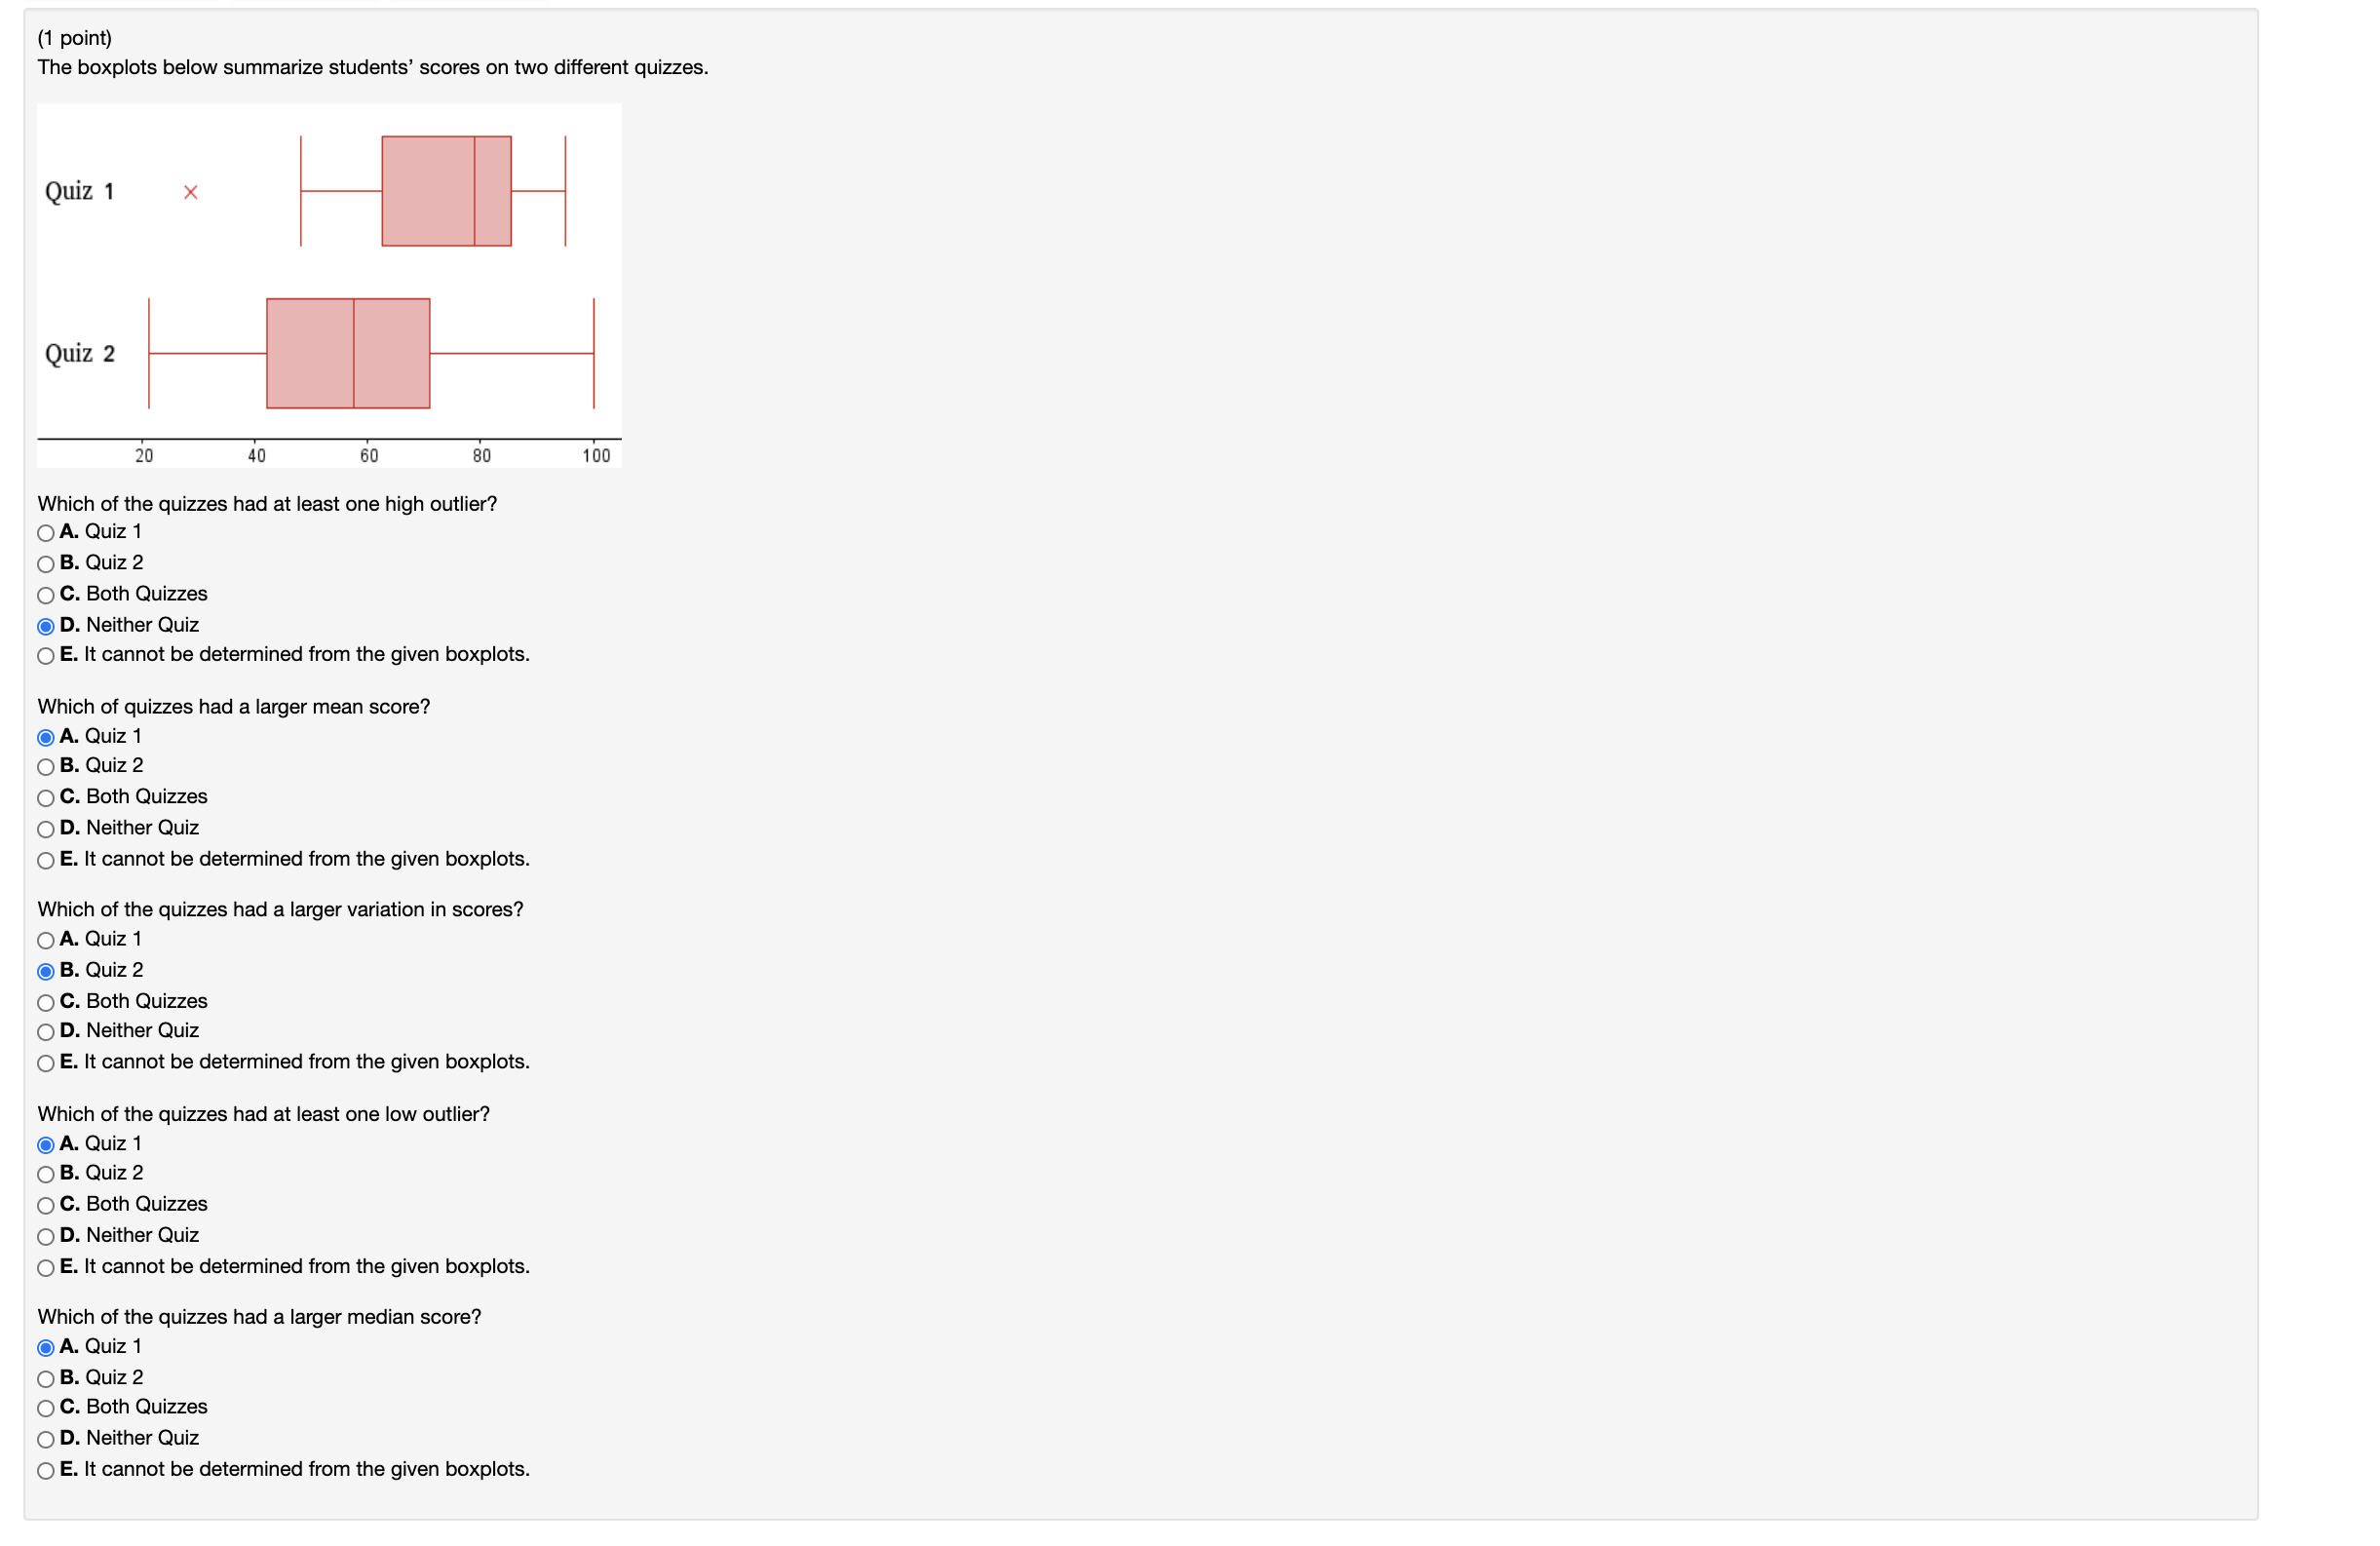
(1 point) In order to estimate the percentage of U.S. adults that own a smartphone, we randomly choose 225 adults from each of the fifty states and an additional 55 adults from Washington, DC. and the U.S. territories, for a total sample size of 11305 adults. Among these 11305, there are 7631 who own a smartphone, giving an estimate of 67.5%. Which of the following numbers are statistics in this scenario? There may be more than one correct answer; you must check all correct answers in order to get credit for this problem. A. 7631 B. 225 C. 55 D. 1 1305 E. 67.5% (1 point) For each of the sampling methods below, is that method unbiased or potentially biased? Simple Random Sample QA. Potentially Biased Q B. Unbiased Stratified Sample A. Potentially Biased 8. Unbiased Cluster Sample A. Potentially Biased O B. Unbiased Systematic Sample OA. Potentially Biased B. Unbiased Convenience Sample A. Potentially Biased O B. Unbiased (1 point) Two histograms are shown below. Histogram 1 15 - 10 8 9 10 11 12 13 14 15 16 17 18 19 Histogram 2 18- 5 - 9 10 11 12 13 14 15 16 17 18 19 a. Which of the histograms shows data that are skewed to the left? OA. Histogram . B. Histogram 2 O C. Both histograms OD. Neither histogram b. Which of the histograms shows data that are skewed to the right? A. Histogram 1 OB. Histogram 2 C. Both histograms OD. Neither histogram c. Which of the histograms shows data that are roughly symmetric? A. Histogram 1 O B. Histogram 2 O C. Both histograms OD. Neither histogram d. Which of histograms shows data for which the mean is significantly smaller than the median? OA. Histogram 1 . B. Histogram 2 O C. Both histograms O D. Neither histogram(1 point) The boxplots below summarize students\" scores on two different quizzes. Quiz 1 x Quiz 2 20 40 60 80 100 Which of the quizzes had at least one high outlie 0A. Quiz 1 O B. Quiz 2 0 c. Bath Quizzes g D. Neither Quiz 0 E. It cannot be determined from the given boxplots. Which of quizzes had a larger mean score? Q A. Quiz 1 O B. Quiz 2 O c. Bath Quizzes O D. Neither Quiz 0 E. It cannot be determined from the given boxplots. Which of the quizzes had a larger variation In scores? 0 A. Quiz 1 Q B. Quiz 2 O c. Both Quizzes 0 D. Neither Quiz 0 E. It cannot be determined lrom the given boxplots. Which of the quizzes had at least one low outlie @ A. Quiz 1 O B. Quiz 2 O C. Both Quizzes O D. Neither Quiz 0 E. It cannot be determined trom the given boxplots. Which of the quizzes had a larger median score? @ A. Quiz 1 O B. Quiz 2 O C. Both Quizzes O D. Neither Quiz 0 E. It cannot be determined from the given boxplots