

Answered step by step
Verified Expert Solution
Question
1 Approved Answer
hi, can yoibplease answer 8-13. thanks for all your help. how do I upload am excel. the answer didn't need to be excel. just sentence


hi, can yoibplease answer 8-13. thanks for all your help.
how do I upload am excel. the answer didn't need to be excel. just sentence form.
I dont know what you are asking.
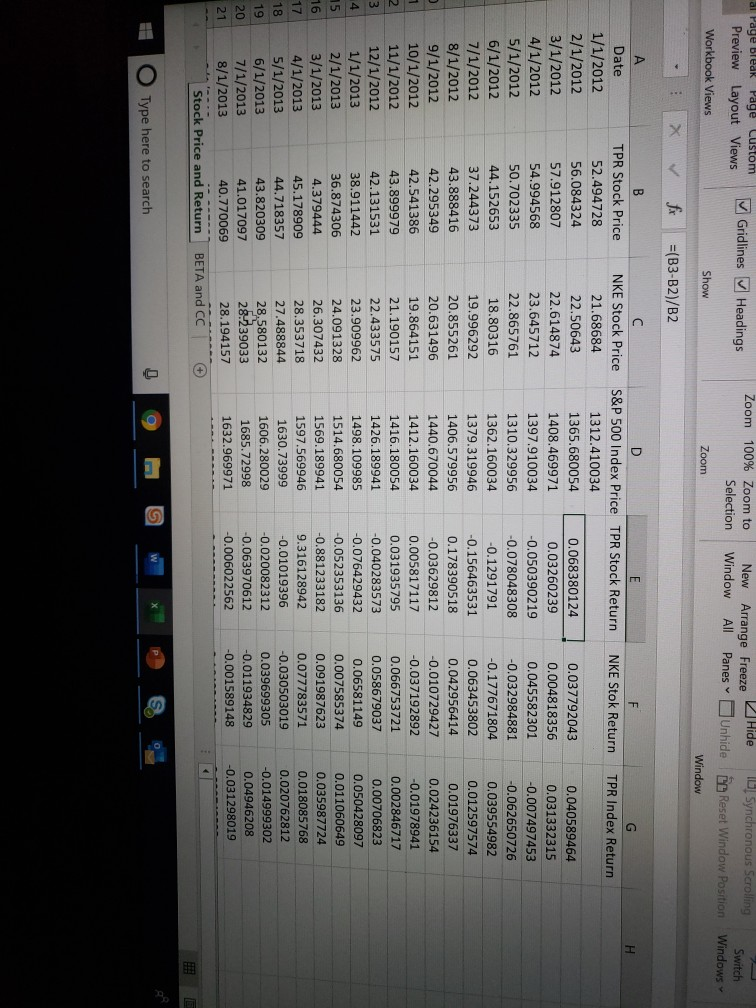
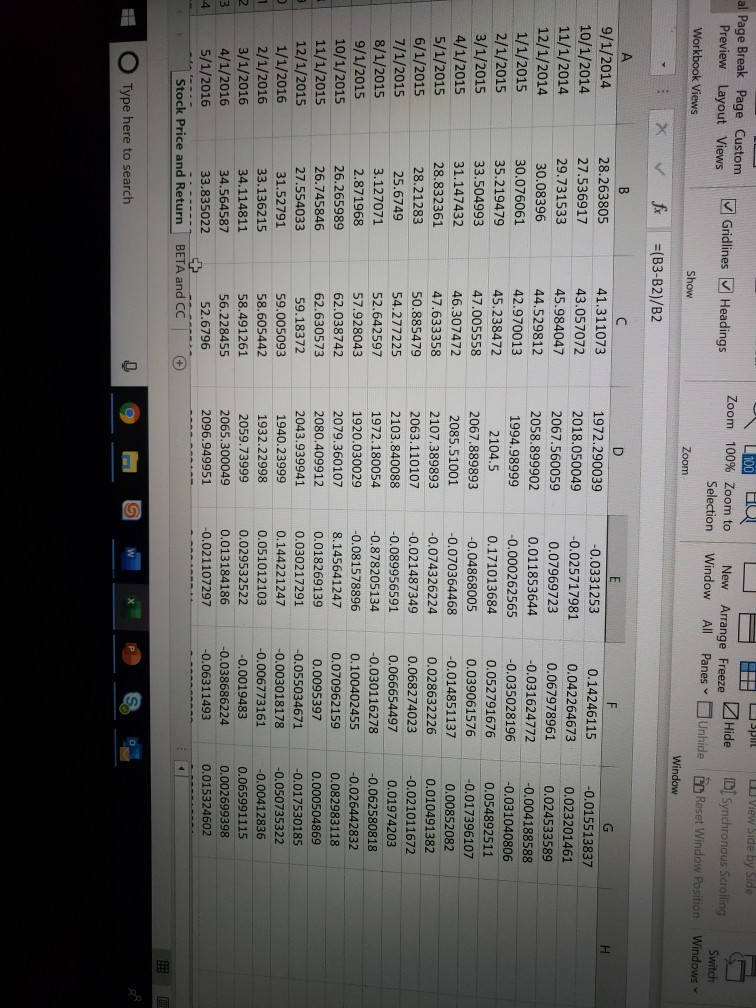
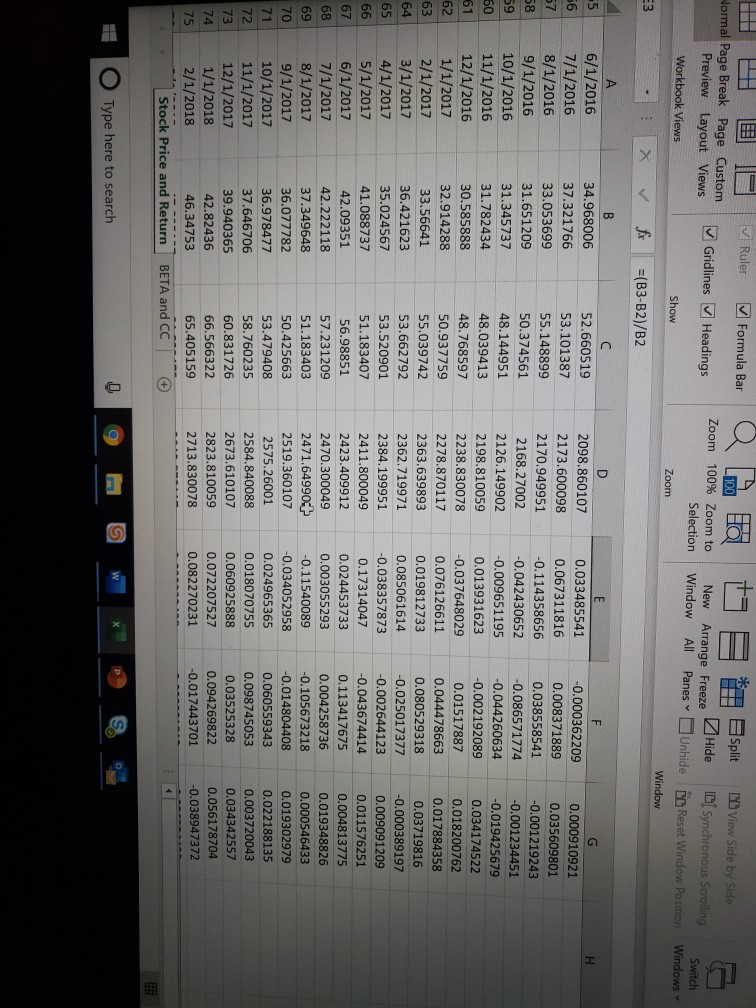
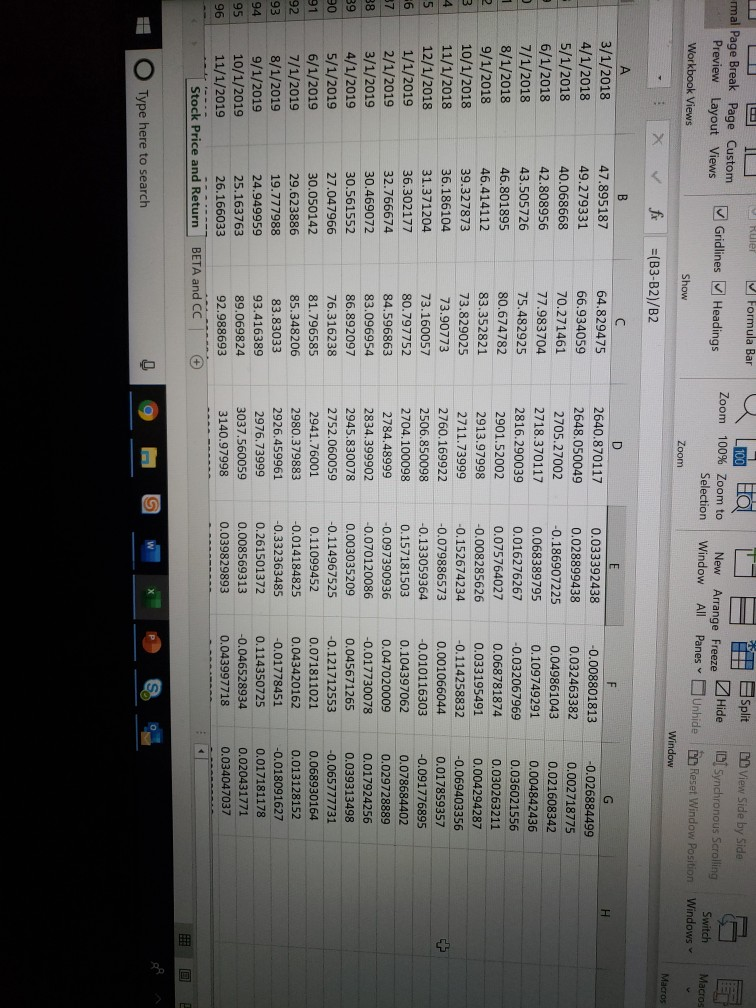
al Page break Page Custom Preview Layout Views Workbook Views Gridlines Zoom Headings 100% Zoom to Selection Zoom New Window Arrange Freeze All Panes" Hide Synchronous Scrolling Unhide De Reset Window Position Window Switch Windows Show - X f x =(B3-B2)/B2 NKE Stok Return TPR Index Return B Date TPR Stock Price 1/1/2012 52.494728 2/1/2012 56.084324 3/1/2012 57.912807 4/1/2012 54.994568 5/1/2012 50.702335 6/1/2012 44.152653 7/1/2012 37.244373 8/1/2012 43.888416 9/1/2012 42.295349 10/1/2012 42.541386 11/1/2012 43.899979 12/1/2012 42.131531 1/1/2013 38.911442 2/1/2013 36.874306 3/1/2013 4.379444 4/1/2013 45.178909 5/1/2013 44.718357 6/1/2013 43.820309 7/1/2013 41.017097 8/1/2013 40.770069 Stock Price and Return NKE Stock Price 21.68684 22.50643 22.614874 23.645712 22.865761 18.80316 19.996292 20.855261 20.631496 19.864151 21.190157 22.433575 23.909962 24.091328 26.307432 28.353718 27.488844 28.580132 28.239033 28.194157 BETA and CC S&P 500 Index Price TPR Stock Return 1312.410034 1365.680054 0.068380124 1408.469971 0.03260239 1397.910034 -0.050390219 1310.329956 -0.078048308 1362.160034 -0.1291791 1379.319946 -0.156463531 1406.579956 0.178390518 1440.670044 -0.03629812 1412.160034 0.005817117 1416.180054 0.031935795 1426.189941 -0.040283573 1498.109985 -0.076429432 1514.680054 -0.052353136 1569.189941 -0.881233182 1597.569946 9.316128942 1630.73999 -0.01019396 1606.280029 -0.020082312 1685.72998 -0.063970612 1632.969971 -0.006022562 0.037792043 0.004818356 0.045582301 -0.032984881 -0.177671804 0.063453802 0.042956414 -0.010729427 -0.037192892 0.066753721 0.058679037 0.06581149 0.007585374 0.091987623 0.077783571 -0.030503019 0.039699305 -0.011934829 -0.001589148 0.040589464 0.031332315 -0.007497453 -0.062650726 0.039554982 0.012597574 0.01976337 0.024236154 -0.01978941 0.002846717 0.00706823 0.050428097 0.011060649 0.035987724 0.018085768 0.020762812 -0.014999302 0.04946208 -0.031298019 16 17 78 19 20 21 O Type here to search al Page Break Page Custom Preview Layout Views Workbook Views Gridlines Headings Zoom L 100 Eu 100% Zoom to Selection Zoom New Window Arrange Freeze All Panes spil View Side by Side Hide DI Synchronous Scrolling Unhide CD Reset Window Position Switch Windows Show Window X V fr =(B3-B2/B2 c D H 9/1/2014 28.263805 10/1/2014 27.536917 11/1/2014 29.731533 12/1/2014 30.08396 1/1/2015 30.076061 2/1/2015 35.219479 3/1/2015 33.504993 4/1/2015 31.147432 5/1/2015 28.832361 6/1/2015 28.21283 7/1/2015 25.6749 8/1/2015 3.127071 9/1/2015 2.871968 10/1/2015 26.265989 11/1/2015 26.745846 12/1/2015 27.554033 1/1/2016 31.52791 2/1/2016 33.136215 3/1/2016 34.114811 4/1/2016 34.564587 5/1/2016 Stock Price and Return 41.311073 43.057072 45.984047 44.529812 42.970013 45.238472 47.005558 46.307472 47.633358 50.885479 54.277225 52.642597 57.928043 62.038742 62.630573 59.18372 59.005093 58.605442 58.491261 56.228455 52.6796 BETA and CC 1972.290039 2018.050049 2067.560059 2058.899902 1994.98999 2104.5 2067.889893 2085.51001 2107.389893 2063.110107 2103.840088 1972.180054 1920.030029 2079.360107 2080.409912 2043.939941 1940.23999 1932.22998 2059.73999 2065.300049 2096.949951 E -0.0331253 -0.025717981 0.07969723 0.011853644 -0.000262565 0.171013684 -0.04868005 -0.070364468 -0.074326224 -0.021487349 -0.089956591 -0.878205134 -0.081578896 8.145641247 0.018269139 0.030217291 0.144221247 0.051012103 0.029532522 0.013184186 -0.021107297 F 0.14246115 0.042264673 0.067978961 -0.031624772 -0.035028196 0.052791676 0.039061576 -0.014851137 0.028632226 0.068274023 0.066654497 -0.030116278 0.100402455 0.070962159 0.0095397 -0.055034671 -0.003018178 -0.006773161 -0.0019483 -0.038686224 -0.06311493 G -0.015513837 0 .023201461 0.024533589 -0.004188588 -0.031040806 0.054892511 -0.017396107 0.00852082 0.010491382 -0.021011672 0.01974203 -0.062580818 -0.026442832 0.082983118 0.000504869 -0.017530185 -0.050735322 -0.00412836 0.065991115 0.002699398 0.015324602 33.835022 O Type here to search Ruler Formula Bar Wormal Page Break Page Custom Preview Layout Views Workbook Views Gridlines Headings Zoom 100% Zoom to Selection Zoom New Window Arrange Freeze All Panes Split View Side by Side Hide DI Synchronous Scrolling Unhide De Reset Window Position Switch Windows Show Window E3 : X f =(B3-B2)/B2 A G 63 64 6/1/2016 34.968006 7/1/2016 37.321766 8/1/2016 33.053699 9/1/2016 31.651209 10/1/2016 31.345737 11/1/2016 31.782434 12/1/2016 30.585888 1/1/2017 32.914288 2/1/2017 33.56641 3/1/2017 36.421623 4/1/2017 35.024567 5/1/2017 41.088737 6/1/2017 42.09351 7/1/2017 42.222118 8/1/2017 37.349648 9/1/2017 36.077782 10/1/2017 36.978477 11/1/2017 37.646706 12/1/2017 39.940365 1/1/2018 42.82436 2/1/2018 46.34753 Stock Price and Return 52.660519 53.101387 55.148899 50.374561 48.144951 48.039413 48.768597 50.937759 55.039742 53.662792 53.520901 51.183407 56.98851 57.231209 51.183403 50.425663 53.479408 58.760235 60.831726 66.566322 65.405159 BETA and CC 2098.860107 2173.600098 2170.949951 2168.27002 2126.149902 2198.810059 2238.830078 2278.870117 2363.639893 2362.719971 2384.199951 2411.800049 2423.409912 2470.300049 2471.64990+ 2519.360107 2575.26001 2584.840088 2673.610107 2823.810059 2713.830078 0.033485541 0.067311816 -0.114358656 -0.042430652 -0.009651195 0.013931623 -0.037648029 0.076126611 0.019812733 0.085061614 -0.038357873 0.17314047 0.024453733 0.003055293 -0.11540089 -0.034052958 0.024965365 0.018070755 0.060925888 0.072207527 0.082270231 -0.000362209 0.008371889 0.038558541 -0.086571774 -0.044260634 -0.002192089 0.01517887 0.044478663 0.080529318 -0.025017377 -0.002644123 -0.043674414 0.113417675 0.004258736 -0.105673218 -0.014804408 0.060559343 0.098745053 0.03525328 0.094269822 -0.017443701 0 .000910921 0.035609801 -0.001219243 -0.001234451 -0.019425679 0.034174522 0.018200762 0.017884358 0.03719816 -0.000389197 0.009091209 0.011576251 0.004813775 0.019348826 0.000546433 0.019302979 0.022188135 0.003720043 0.034342557 0.056178704 -0.038947372 69 71 72 73 74 75 O Type here to search Ruler Formula Bar 1 L L IL -rmal Page Break Page Custom Preview Layout Views Workbook Views Gridlines Headings Zoom L100 Hal 100% Zoom to Selection Zoom New Window Arrange Freeze All Panes Split CD View Side by Side Hide DI Synchronous Scrolling Unhide De Reset Window Position Switch Windows Macros Show Window Macros X fr =(B3-B2)/B2 3 B 3/1/2018 47.895187 4/1/2018 49.279331 5/1/2018 40.068668 6/1/2018 42.808956 7/1/2018 43.505726 8/1/2018 46.801895 9/1/2018 46.414112 10/1/2018 39.327873 11/1/2018 36.186104 12/1/2018 31.371204 1/1/2019 36.302177 2/1/2019 32.766674 3/1/2019 30.469072 4/1/2019 30.561552 5/1/2019 27.047966 6/1/2019 30.050142 7/1/2019 29.623886 8/1/2019 19.777988 9/1/2019 24.949959 10/1/2019 25.163763 11/1/2019 26.166033 Stock Price and Return 64.829475 66.934059 70.271461 77.983704 75.482925 80.674782 83.352821 73.829025 73.90773 73.160057 80.797752 84.596863 83.096954 86.892097 76.316238 81.796585 85.348206 83.83033 93.416389 89.069824 92.988693 BETA and CC + 2640.870117 2648.050049 2705.27002 2718.370117 2816.290039 2901.52002 2913.97998 2711.73999 2760.169922 2506.850098 2704.100098 2784.48999 2834.399902 2945.830078 2752.060059 2941.76001 2980.379883 2926.459961 2976.73999 3037.560059 3140.97998 E 0.033392438 0.028899438 -0.186907225 0.068389795 0.016276267 0.075764027 -0.008285626 -0.152674234 -0.079886573 -0.133059364 0.157181503 -0.097390936 -0.070120086 0.003035209 -0.114967525 0.11099452 -0.014184825 -0.332363485 0.261501372 0.008569313 0.039829893 F -0.008801813 0.032463382 0.049861043 0.109749291 -0.032067969 0.068781874 0.033195491 -0.114258832 0.001066044 -0.010116303 0.104397062 0.047020009 -0.017730078 0.045671265 -0.121712553 0.071811021 0.043420162 -0.01778451 0.114350725 -0.046528934 0.043997718 -0.026884499 0.002718775 0.021608342 0.004842436 0.036021556 0.030263211 0.004294287 -0.069403356 0.017859357 -0.091776895 0.078684402 0.029728889 0.017924256 0.039313498 -0.065777731 0.068930164 0.013128152 -0.018091627 0.017181178 0.020431771 0.034047037 91 95 96 O Type here to search Finance HW3 part 2 - Search File Home Insert Page Layout Formulas Data Review View Help Power Pivot Ruler Formula Bar Normal Page Break Page Custom Preview Layout Views Gridlines Headings Zoom 100% Zoom to Selection New Arrange Freeze Window All Panes" Split Dn View Side by Side Hide D Synchronous Scrolling Unhide Reset Window Position Window Workbook Views Show Switch Windows Zoom E3 X fx =(B3-B2)/B2 A 3/1/2019 4/1/2019 5/1/2019 6/1/2019 7/1/2019 8/1/2019 9/1/2019 10/1/2019 11/1/2019 12/1/2019 30.469072 30.561552 27.047966 30.050142 29.623886 19.777988 24.949959 25.163763 26.166033 26.243877 83.096954 86.892097 76.316238 81.796585 85.348206 83.83033 93.416389 89.069824 92.988693 101.029694 2834.399902 2945.830078 2752.060059 2941.76001 2980.379883 2926.459961 2976.73999 3037.560059 3140.97998 3230.780029 -0.070120086 0.003035209 -0.114967525 0.11099452 -0.014184825 -0.332363485 0.261501372 0.008569313 0.039829893 0.002975002 -0.017730078 0.045671265 -0.121712553 0.071811021 0.043420162 -0.01778451 0.114350725 -0.046528934 0.043997718 0.08647289 0.017924256 0.039313498 -0.065777731 0.068930164 0.013128152 -0.018091627 0.017181178 0.020431771 0.034047037 0.028589819 Stock Price and Return BETA and CC O Type here to search # B C Ruler Formula Bar Break Page Custom Gridlines Zoom Headings 100% Zoom to Selection Split Hide Unhide New Window Arrange Freeze All Panes wiew Layout Views rkbook Views D View Side by Side DI Synchronous Scrolling Do Reset Window Position Switch Windows Macros Show Zoom Window Macros X ft EF TPR Stock Return NKE Stok Return TPR Index Return Date 1/1/2012 2/1/2012 3/1/2012 4/1/2012 5/1/2012 6/1/2012 7/1/2012 8/1/2012 9/1/2012 10/1/2012 11/1/2012 12/1/2012 1/1/2013 2/1/2013 3/1/2013 4/1/2013 5/1/2013 6/1/2013 7/1/2013 8/1/2013 Stock Price and Return 0.068380124 0.03260239 -0.050390219 -0.078048308 -0.1291791 -0.156463531 0.178390518 -0.03629812 0.005817117 0.031935795 -0.040283573 -0.076429432 -0.052353136 -0.881233182 9.316128942 -0.01019396 -0.020082312 -0.063970612 -0.006022562 0.037792043 0.004818356 0.045582301 -0.032984881 -0.177671804 0.063453802 0.042956414 -0.010729427 -0.037192892 0.066753721 0.058679037 0.06581149 0.007585374 0.091987623 0.077783571 -0.030503019 0.039699305 -0.011934829 -0.001589148 0.040589464 0.031332315 -0.007497453 -0.062650726 0.039554982 0.012597574 0.01976337 0.024236154 -0.01978941 0.002846717 0.00706823 0.050428097 0.011060649 0.035987724 0.018085768 0.020762812 -0.014999302 0.04946208 -0.031298019 BETA and CC O Type here to search J 9/1/2019 10/1/2019 11/1/2019 12/1/2019 0.0 B 0.261501372 0.008569313 0.039829893 0.002975002 0.114350725 -0.046528934 0.043997718 0.08647289 0.0 0.03 0.02 Beta of TPR Beta of NKE 1 Correlation coefficient between TPR and NKE 2 Correlation coefficient between TPR and S&P market 3 Correlation coefficient between NKE and S&P market 8.324263984 0.721714827 0.157528234 0.206930517 0.388838201 >1, riskier than the market >1,riskier than the market These two stocks have a low positive CG TPR has a low positive CC with the market NKE has a low positive CC with the market 10 11 12 113 114 Stock Price and Return BETA and CC O Type here to search Then you need to write a memo using Microsoft word: 8. Explain what "beta" is; 9. Use the concept of beta to explain how risky your stock is relative to the S&P500; 10. Explain what Correlation Coefficient is; 11. Explain the CC between the two stocks; 12. Explain the CC between TPR and the market, S&P 500; 13. Explain the CC between NKE and the market, S&P 500Step by Step Solution
There are 3 Steps involved in it
Step: 1

Get Instant Access to Expert-Tailored Solutions
See step-by-step solutions with expert insights and AI powered tools for academic success
Step: 2

Step: 3
Ace Your Homework with AI
Get the answers you need in no time with our AI-driven, step-by-step assistance
Get Started
The Concise Guide To Mergers Acquisitions And Divestitures Business Legal Finance Accounting Tax And Process Aspects
Authors: R. Brown
1st Edition
0230600786,0230608949