

Answered step by step
Verified Expert Solution
Question
1 Approved Answer
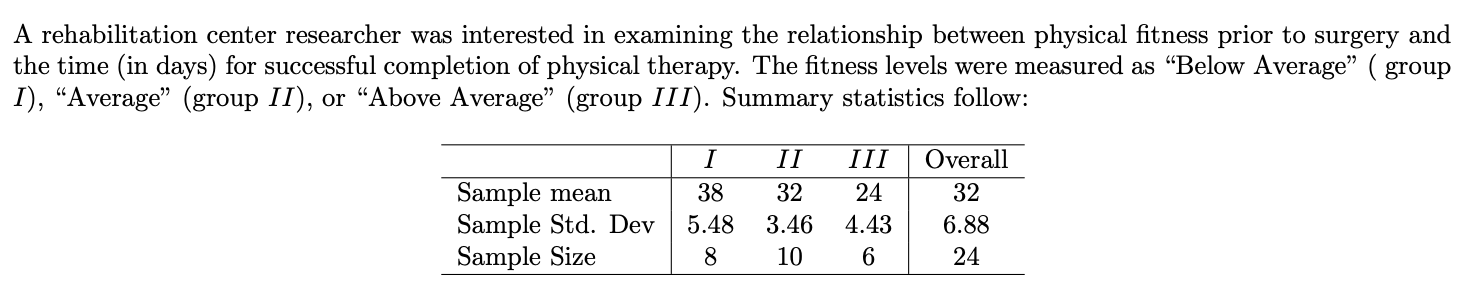
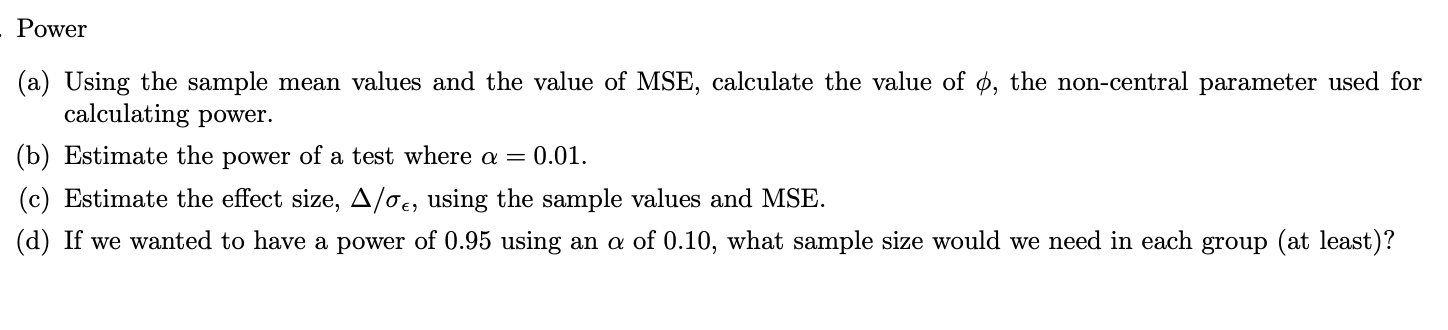
HI can you answer the questions and give a detailed explanation (the data table is above)? Thank you! A rehabilitation center researcher was interested in
HI can you answer the questions and give a detailed explanation (the data table is above)? Thank you!
Step by Step Solution
There are 3 Steps involved in it
Step: 1

Get Instant Access to Expert-Tailored Solutions
See step-by-step solutions with expert insights and AI powered tools for academic success
Step: 2

Step: 3
Ace Your Homework with AI
Get the answers you need in no time with our AI-driven, step-by-step assistance
Get Started
Probability and Stochastic Processes A Friendly Introduction for Electrical and Computer Engineers
Authors: Roy D. Yates, David J. Goodman
3rd edition
1118324560, 978-1118324561