Hi expert only correct answer please no explanation required
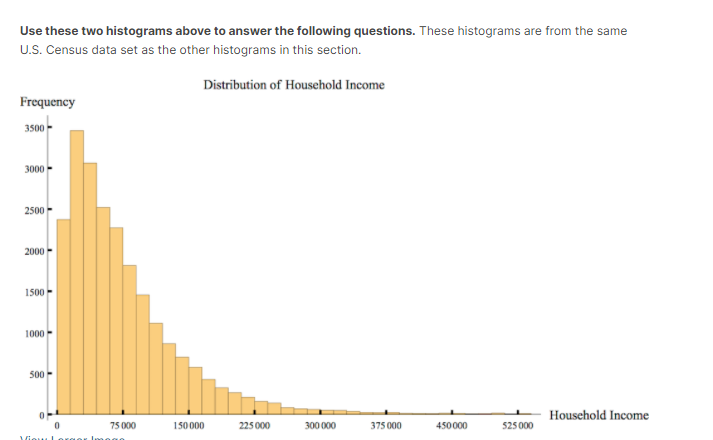
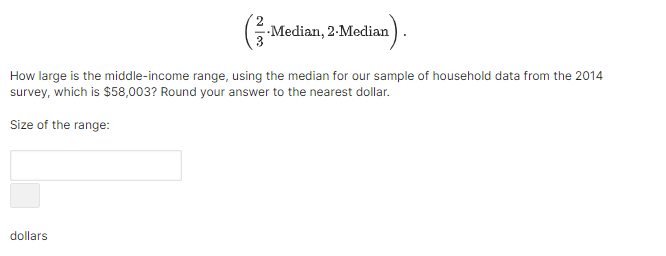
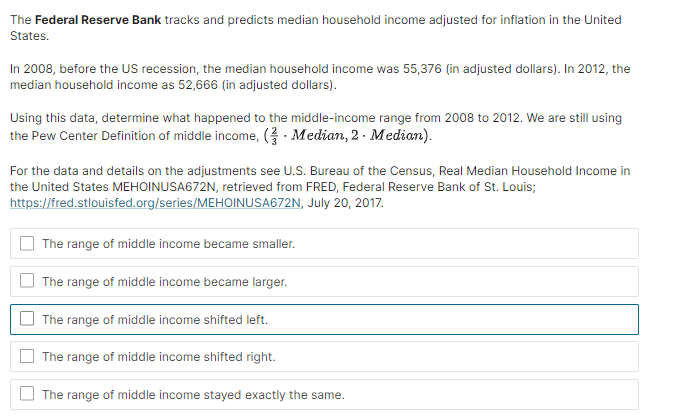
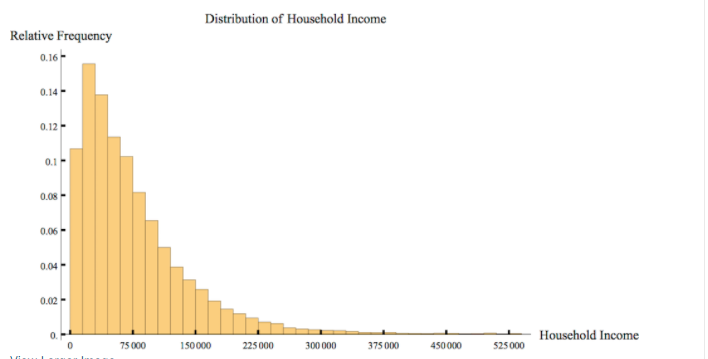
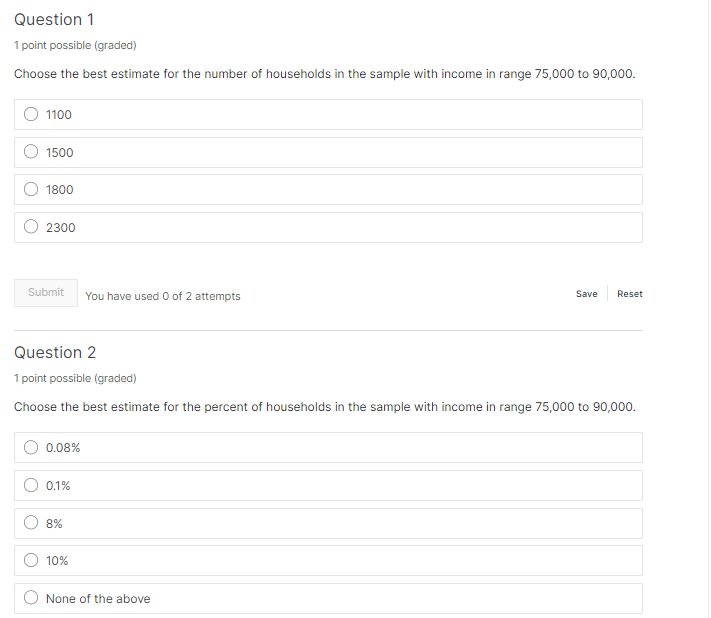
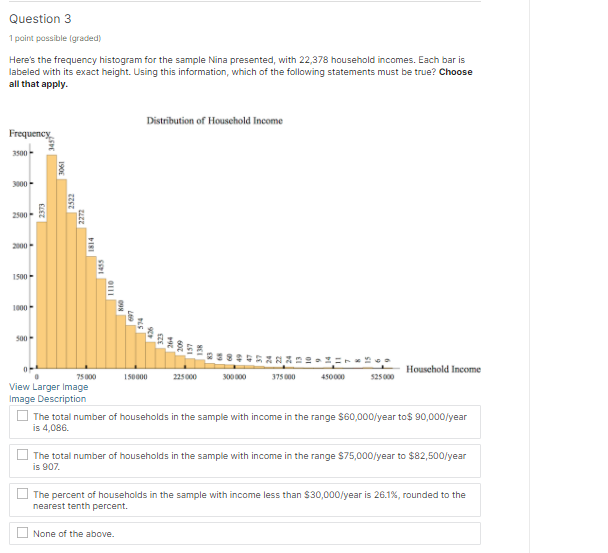
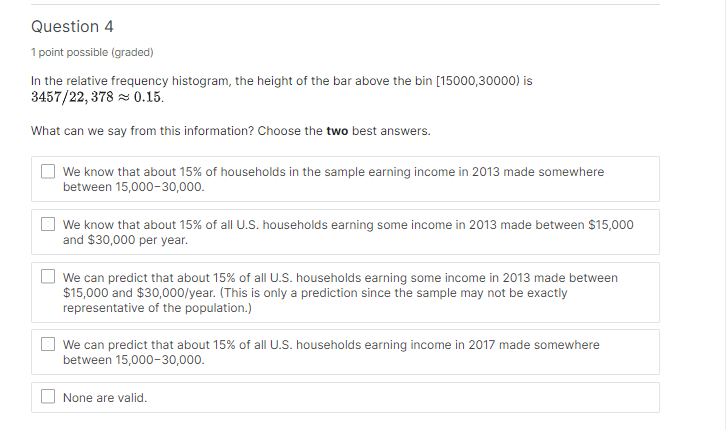
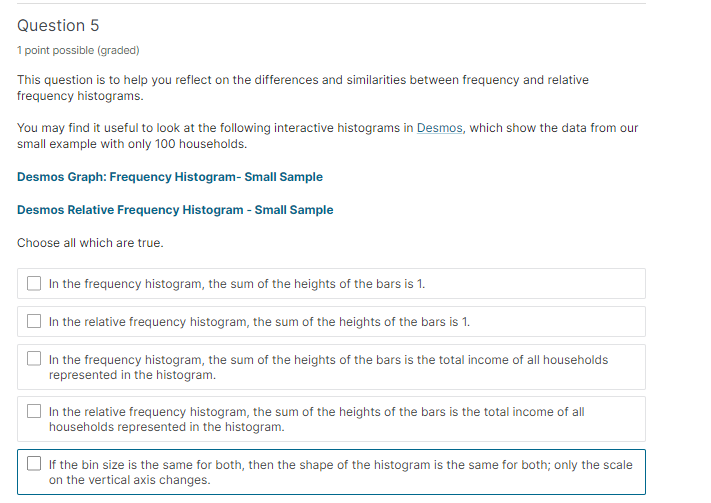
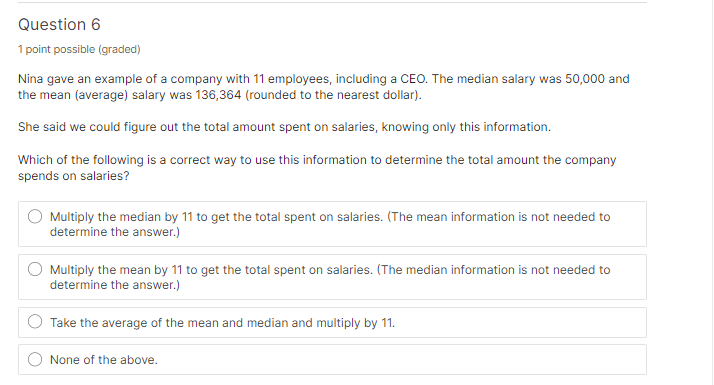
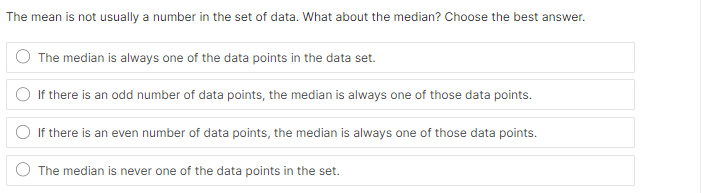
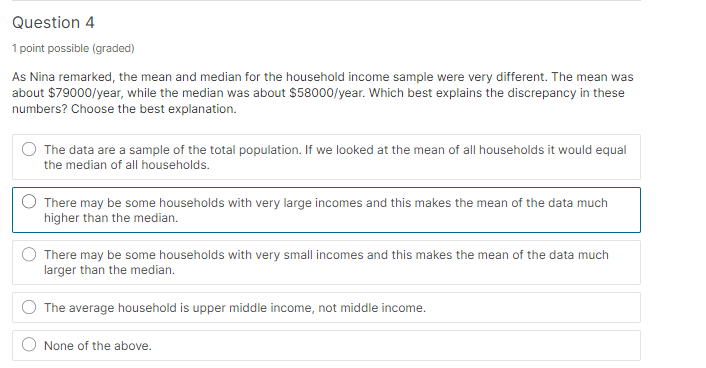
Use these two histograms above to answer the following questions. These histograms are from the same U.S. Census data set as the other histograms in this section. Distribution of Household Income Frequency 3500 - 3000 - 2500- 2000- 1500 1000 - 500 75 000 150 000 225 000 Household Income 300 000 375 000 450 000 525 000Median, 2-Median - How large is the middle-income range, using the median for our sample of household data from the 2014 survey, which is $58,003? Round your answer to the nearest dollar. Size of the range: dollarsThe Federal Reserve Bank tracks and predicts median household income adjusted for inflation in the United States. In 2003, before the US recessionr the median household income was 55,3?E [in adjusted dollars]. In 2G12, the median household income as 52,656 [in adjusted dollars}. Using this data, determine what happened to the middleincome range from 24303 to 2:312. We are still using the Pew Center Definition of middle income, (% - Median, 2 - Median}. For the data and details on the adjustments see US. Bureau of the Census, Real Median Household Income in the United States MEHDINUSAEFEN, retrieved from FRED, Federal Reserve Bank of St. Louis; h_ttps:.l_'red.stlouisfed.org{seriesl_'MEHE}|NUSABFEN, July 20, 201?. H The range of middle income became smaller. [1 The range of middle income became larger. D The range of middle income shifted lett. I:I The range of middle income shifted right. [1 The range of middle income stayed exactly the same. Distribution of Household Income Relative Frequency 0.16- 0.14- 0.12 0.08- 0.06 0.04 - 0.02 0. Household Income 75 000 150 000 225 000 300 000 375 000 450 000 525000Question '| 1 point possible [gradedl Choose the best estimate for the number of households in the sample with income in range moon to sense. Submit ll'ou have used D of 2 attempts 53"\"! RES\" Question 2 1 point possible (graded: Choose the best estimate for the percent of households in the sample with income in range T5,DGD to QDJIIGCI. 0 None of the above Question 3 1 point possible [graded) Here's the frequency histogram for the sample Nina presented, with 22,378 household incomes. Each bar is labeled with its exact height. Using this information, which of the following statements must be true? Choose all that apply. Distribution of Household Income Frequency 3500 3061 2521 3500 2271 2000 1814 1:500 - 500- 323 - Household Income 75000 1 50000 225 060 300 600 375 000 450 000 525 000 View Larger Image Image Description The total number of households in the sample with income in the range $60,000/year to$ 90,000/year IS 4,086. The total number of households in the sample with income in the range $75,000/year to $82,500/year is 907. The percent of households in the sample with income less than $30,000/year is 26.1%, rounded to the nearest tenth percent. None of the above.Question 4 1 point possible (graded: In the relative frequency histogram, the height of the bar above the bin [15Gu,3i}l is 3457,1'22, 373 so (1.15. What can we say from this information? Choose the mo best answers. [_J we know that about 15% of households in the sample earning income in 2013 made somewhere between 15,000-3b. I:I We know that about 15% of all [1.5. households earning some income in 2013 made between $15,013:] and $3, per year. F] We can predict that about 15% of all US. households earning some income in 2013 made between $1s,ooo and ammyear. [This is only a prediction since the sample may not be exactly representative of the population.) I:I We can predict that about 15% of all L.|.S. households earning income in 2E1? made somewhere between 15,060-3G. l_l None are valid. Question 5 1 point possible lgraclecll This question is to help you reflect on the differences and similarities between frequency and relative frequency histogram s. You may nd it useful to look at the following interactive histograms in Desmos, which show the data from our small example with only 100 household s. Desmos Graph: Frequency Histogram Small Sample Desmos Relative Frequency Histogram Small Sample Choose all which are true. [7 In the frequency histogram, the sum of the heights of the bars is 'I. I:I In the relative frequency histogram, the sum of the heights of the bars is 'I. F] In the frequency histogram, the sum of the heights of the bars is the total income of all households represented in the histogram. I:I In the relative frequency histogram, the sum of the heights of the bars is the total income of all households represented in the histogram. D If the bin size is the same for both, then the shape of the histogram is the same for both; only the scale on the vertical axis changes. Question 6 1 point possible (graded: Nina gave an example of a company with 11 employees, including a CEO. The median salary was soooo and the mean [average] salary was 13,34 [round ed to the nearest dollar}. She said we could figure out the total amount spent on salaries, knowing only this information. Which of the following is a correct way to use this information to determine the total amount the company spends on salaries? {3 Multiply the median by 11 to get the total spent on salaries. {The mean information is not needed to determine the answer.] (:1 Multiply the mean by 11 to get the total spent on salaries. [The median information is not needed to determine the answer.] 0 Take the average of the mean and median and multiply by 11. {:1 None of the above. The mean is not usually a number in the set of data. II.l'I.lhat about the median? Choose the best answer. Q The median is always me at the data paints in the data set. Cl If there is an odd number of data truttnintsr the median is always one of these data points. C) If there is an even number of data points, the median is always one of these data points. 0 The median is neyer one at the data points in the set. Question 4 1 point possible (graded: As Nina re marked, the mean and median for the household in come sample were very different. The mean was about $TQuuiy'9ar, while the median was about ESBuulvear. Which he st explains the discrepancy in these numbers? Choose the best explanation. O The data are a sample of the total population. If we looked at the mean of all households it would equal the median of all households. 0 There may be some households with very large incomes and this makes the mean of the data much higher than the median. C) There may be some households with verv small incomes and this makes the mean of the data much larger than the median. O The average household is upper middle income, not middle income. 0 None of the above