Question
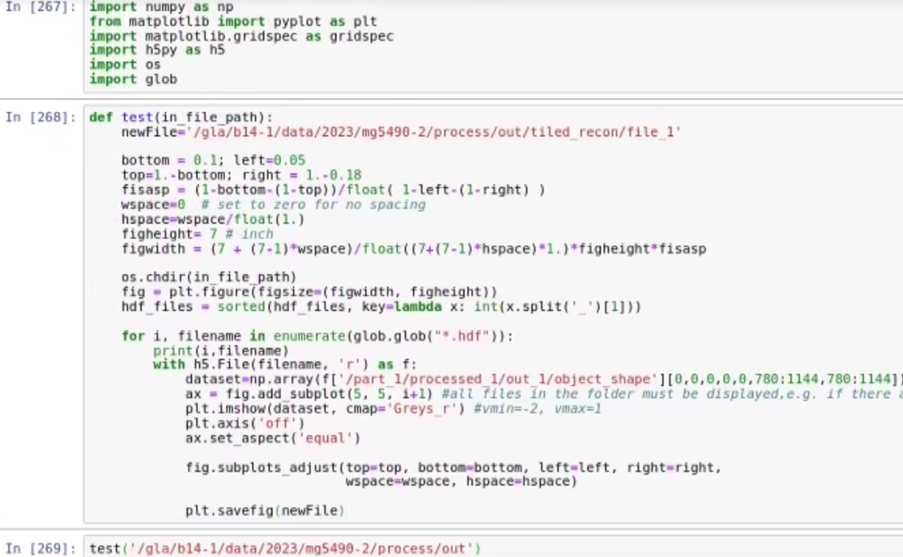
Hi, hope you are well In the first image is code that takes multiple hdf files of images and creates a subplot/grid which works perfectly


Hi, hope you are well
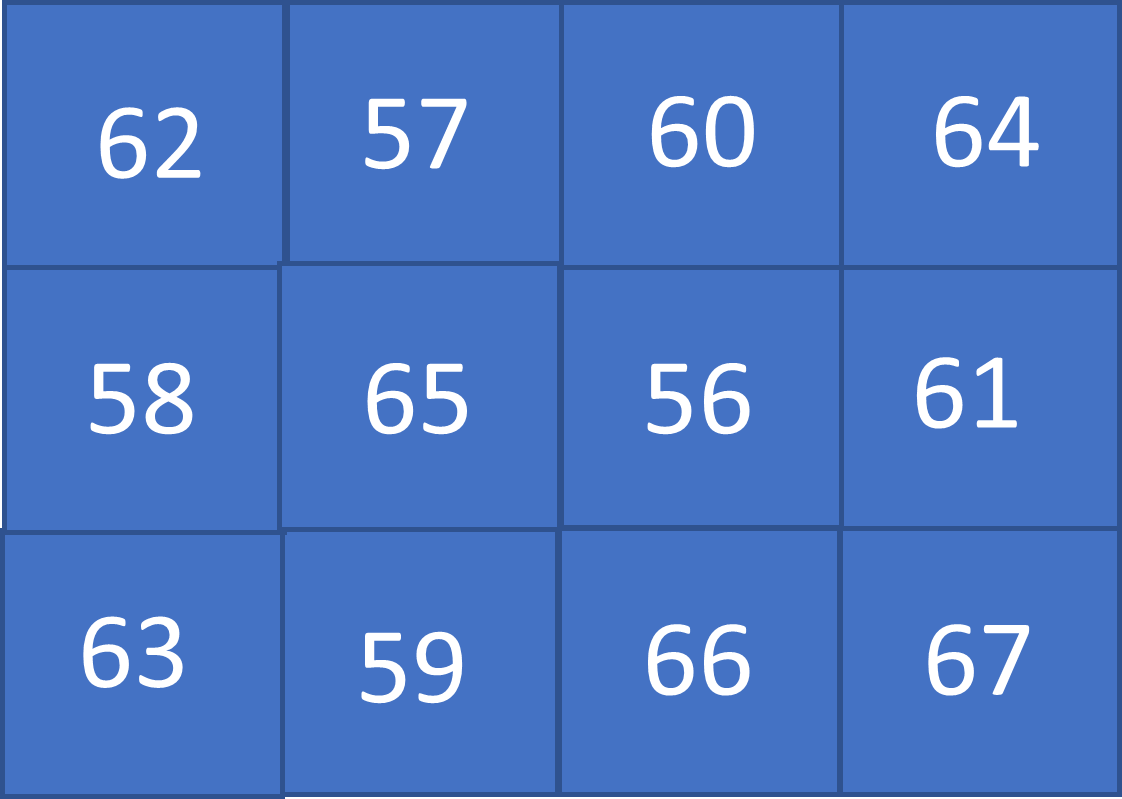
In the first image is code that takes multiple hdf files of images and creates a subplot/grid which works perfectly fine (see the second image).
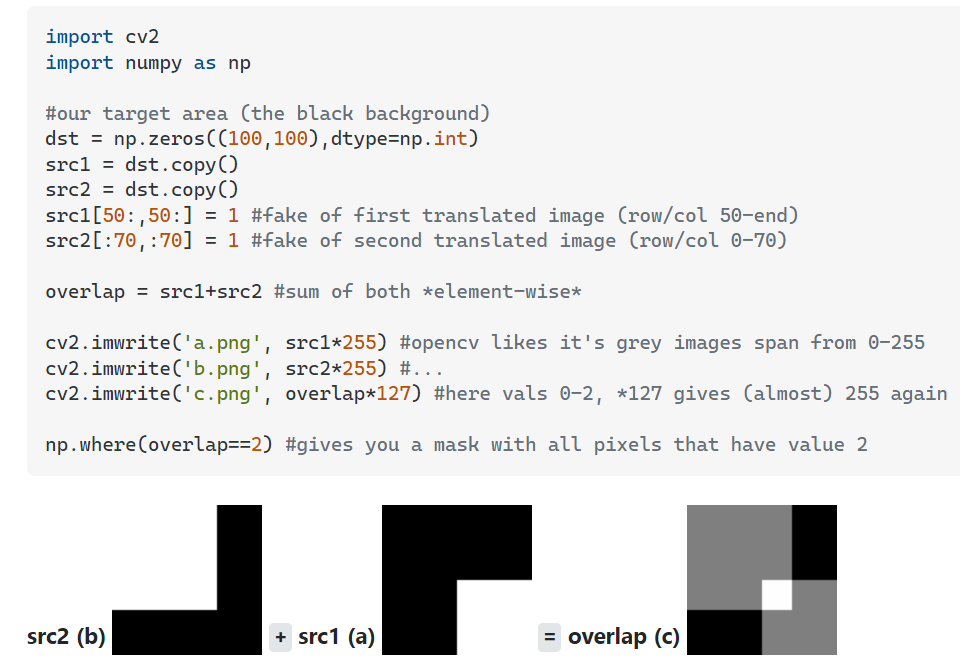
I'm trying to move each image horizontally and vertically by x amount (so they overlap).
Is it possible for you to write the code for me? The third image is attached as it is a good guide.
Also, could you please fix the line of code which sorts the hdf files by the number in the filename as it doesn't seem to work? This is where it says: "hdf_files = sorted(hdf_files, key=lambda x: int(x.split('_')[1]))". I get the error "local variable 'hdf_files' referenced before assignment"
Please do not rush your answer :)
Thanks in advance, I appreciate your help.
\begin{tabular}{|c|c|c|c|} \hline 62 & 57 & 60 & 64 \\ \hline 58 & 65 & 56 & 61 \\ \hline 63 & 59 & 66 & 67 \\ \hline \end{tabular} import cv2 import numpy as np \#our target area (the black background) dst = np. zeros ((100,100), dtype=np.int) src1 = dst.copy() src2 = dst. copy() src1 [50:,50:]=1 \#fake of first translated image (row/col 50-end) src2 [:70,:70]=1 \#fake of second translated image (row/col 0-70) overlap = src1+src2 \#sum of both *element-wise* cv2.imwrite('a.png', src1*255) \#opencv likes it's grey images span from 0255 cv2.imwrite('b.png', src 2255) \#... cv2.imwrite('c.png', overlap*127) \#here vals 02,127 gives (almost) 255 again np.where(overlap==2) \#gives you a mask with all pixels that have value 2 sr overlap (c)Step by Step Solution
There are 3 Steps involved in it
Step: 1

Get Instant Access to Expert-Tailored Solutions
See step-by-step solutions with expert insights and AI powered tools for academic success
Step: 2

Step: 3

Ace Your Homework with AI
Get the answers you need in no time with our AI-driven, step-by-step assistance
Get Started


