

Question
hi I am wondering if I am on the right track as if I run two separate functions, my graph still looks the same. I
hi
I am wondering if I am on the right track as if I run two separate functions, my graph still looks the same. I could not find a lab example for this.
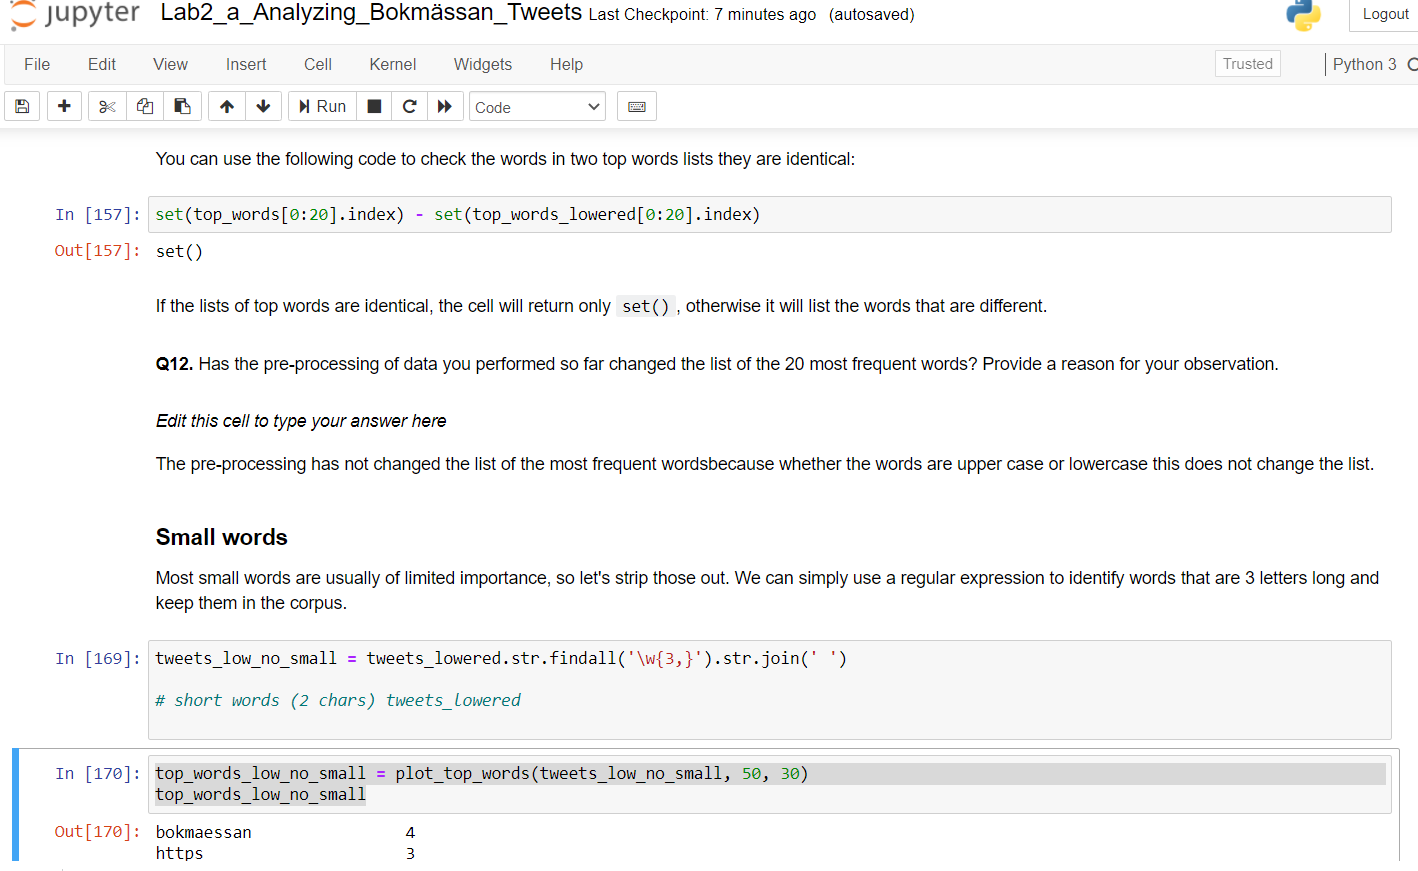
To find the top words we will do more work with our next functionplot_top_words(). In this function we sum up each of the columns in the TDM, sort the word frequencies by counts, return the top sorted words list, and additionally plot these words in a nice bar chart.
After defining our ownplot_top_words()function, we can use it by using the tweets corpus as input (be patient as it make take some time for the function to complete processing):
top_words = plot_top_words(clean_tweets, 50, 30)
top_words
In the next cell, write some code to plot the top words again with the lowered tweets corpus. Replace the ellipsis (...) with your own code:
top_words_lowered = plot_top_words(tweets_lowered, 50, 30)
top_words_lowered
Step by Step Solution
There are 3 Steps involved in it
Step: 1

Get Instant Access to Expert-Tailored Solutions
See step-by-step solutions with expert insights and AI powered tools for academic success
Step: 2

Step: 3
Ace Your Homework with AI
Get the answers you need in no time with our AI-driven, step-by-step assistance
Get Started
Financial management theory and practice
Authors: Eugene F. Brigham and Michael C. Ehrhardt
12th Edition
978-0030243998, 30243998, 324422695, 978-0324422696