Hi I did the experiment and I have the data attached in the graphs. I just need help with the data analysis question number 4(not the graphing part) and number 7. I also need help with the discussion of data analysis questions 1 through 4. I don't have any other data besides what I did on the software Capstone- would that be helpful to see?
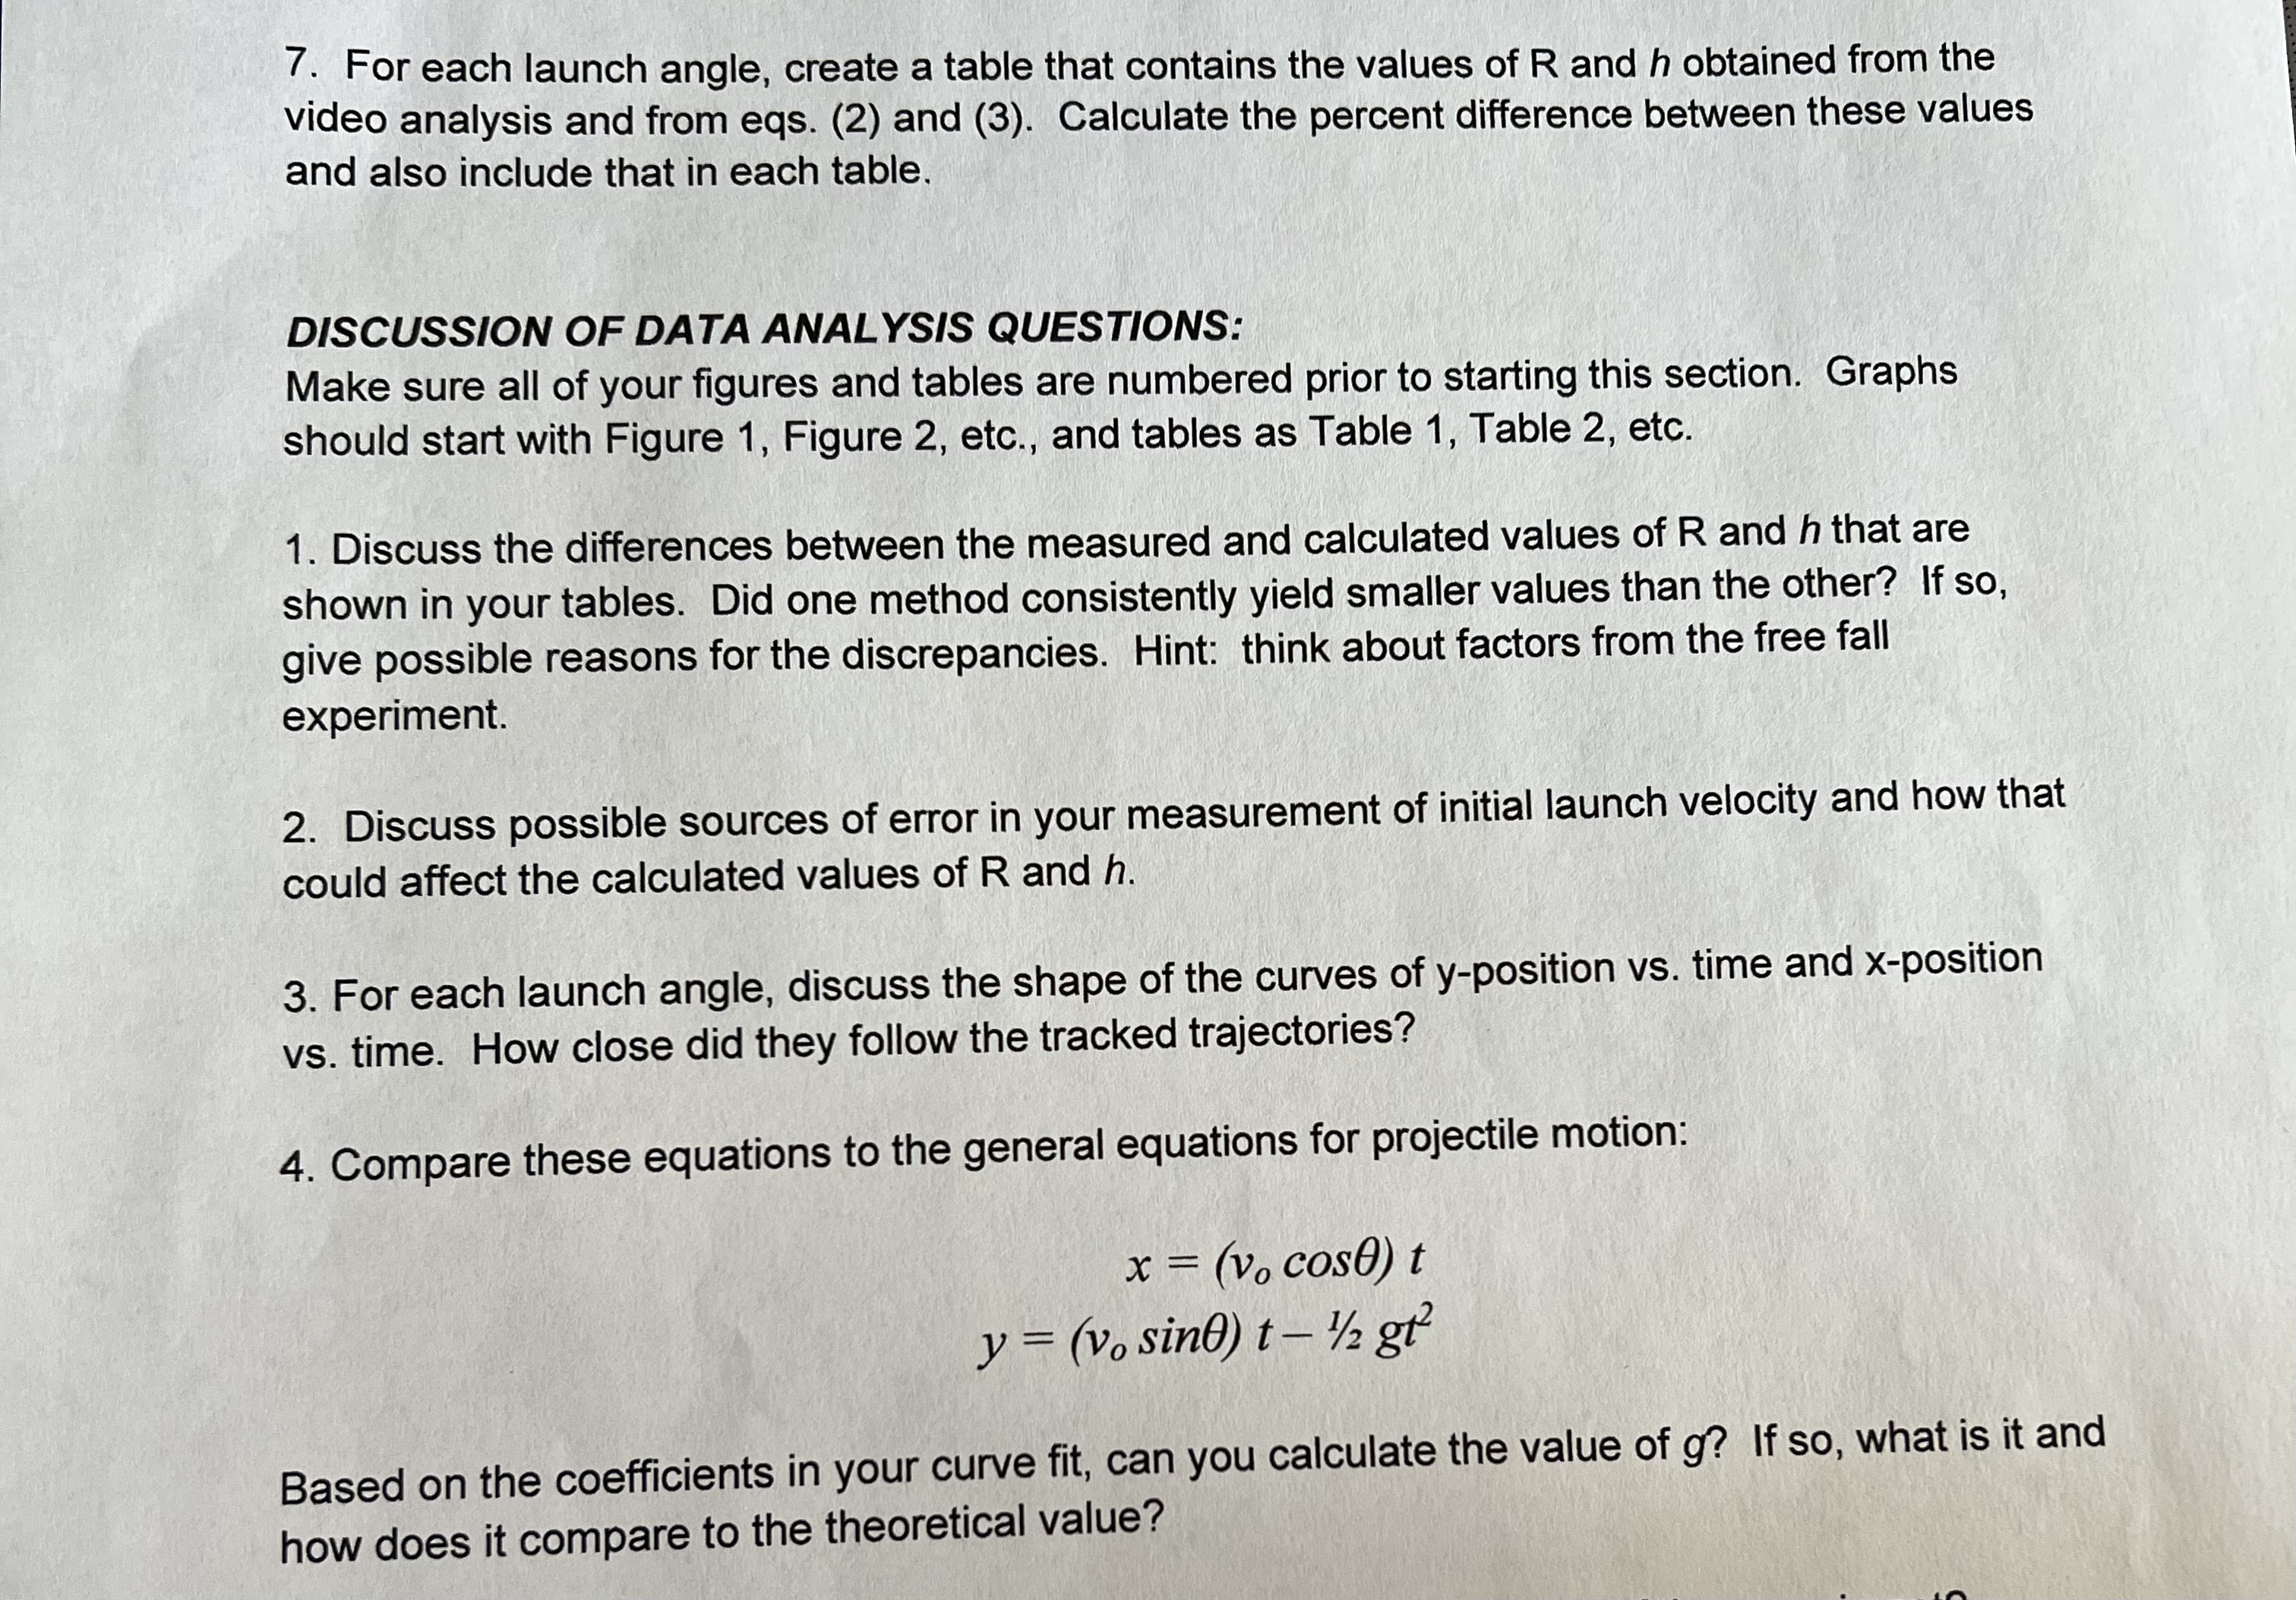
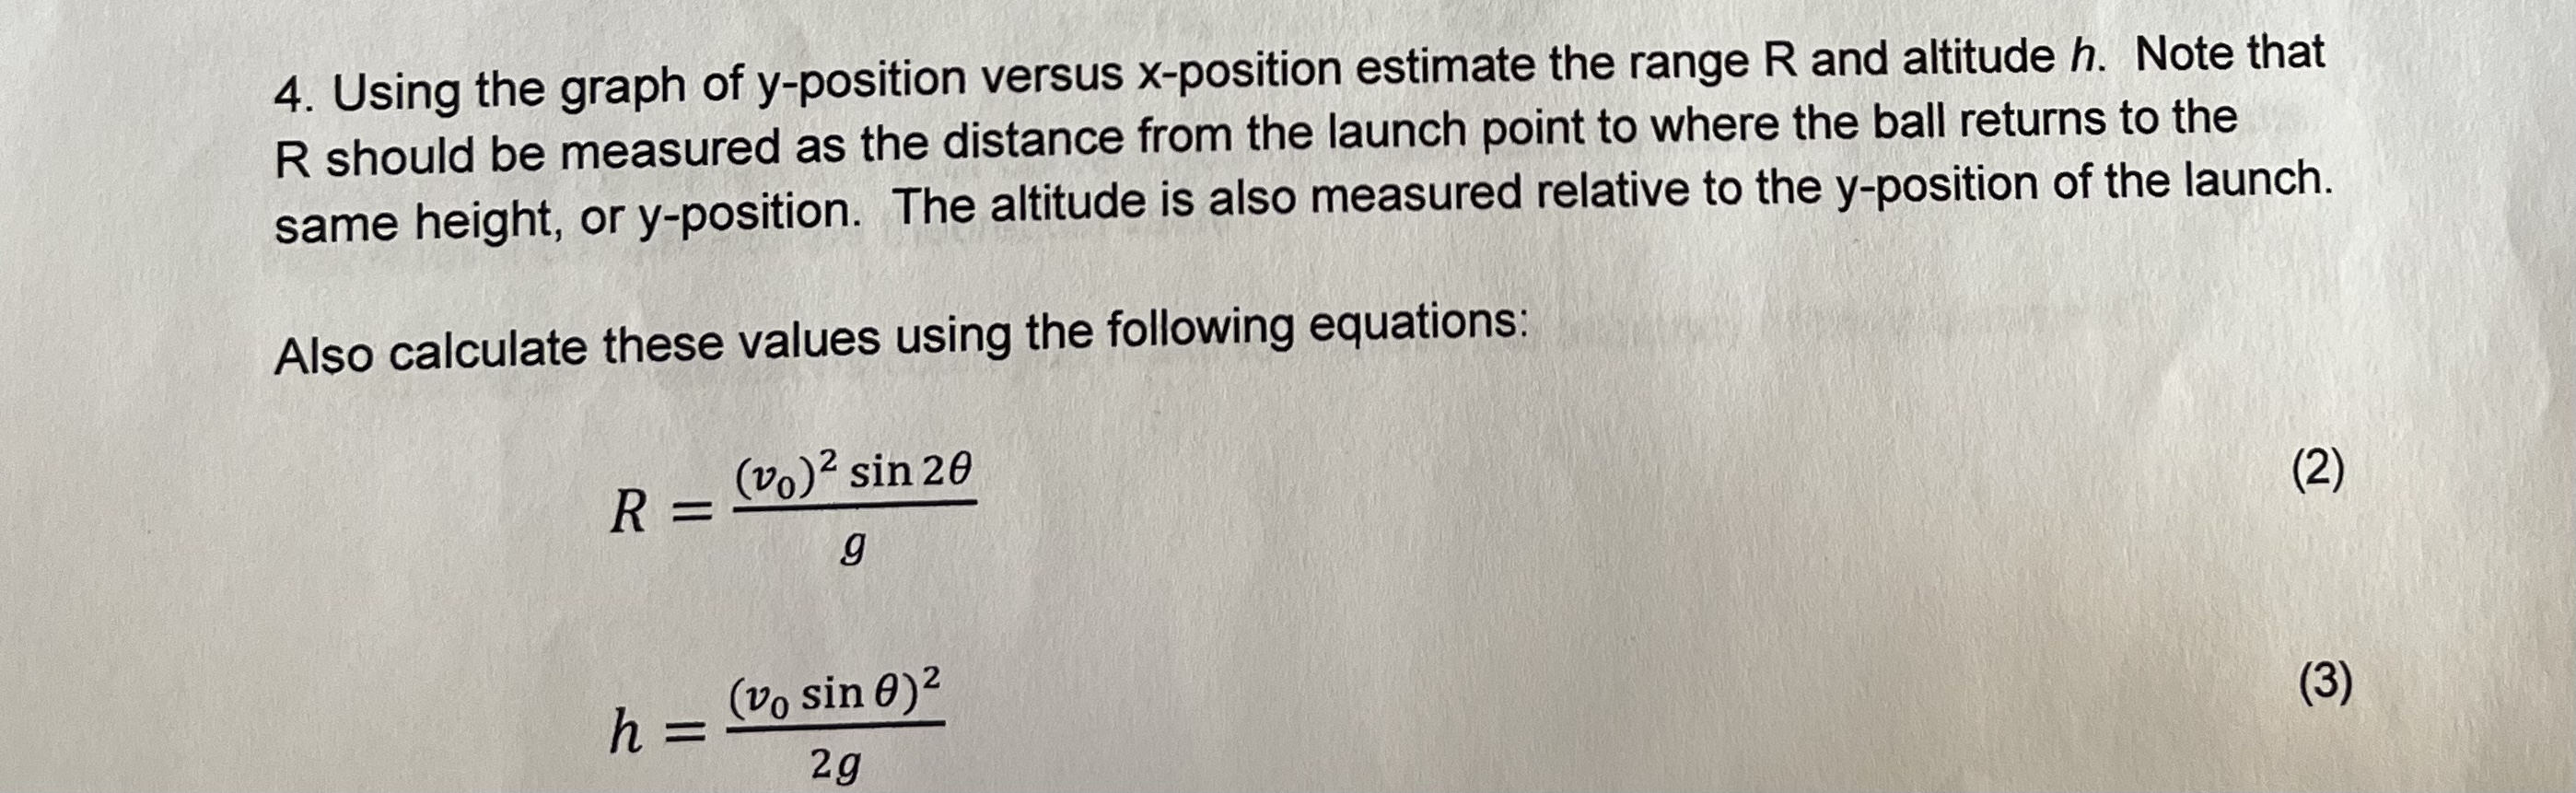
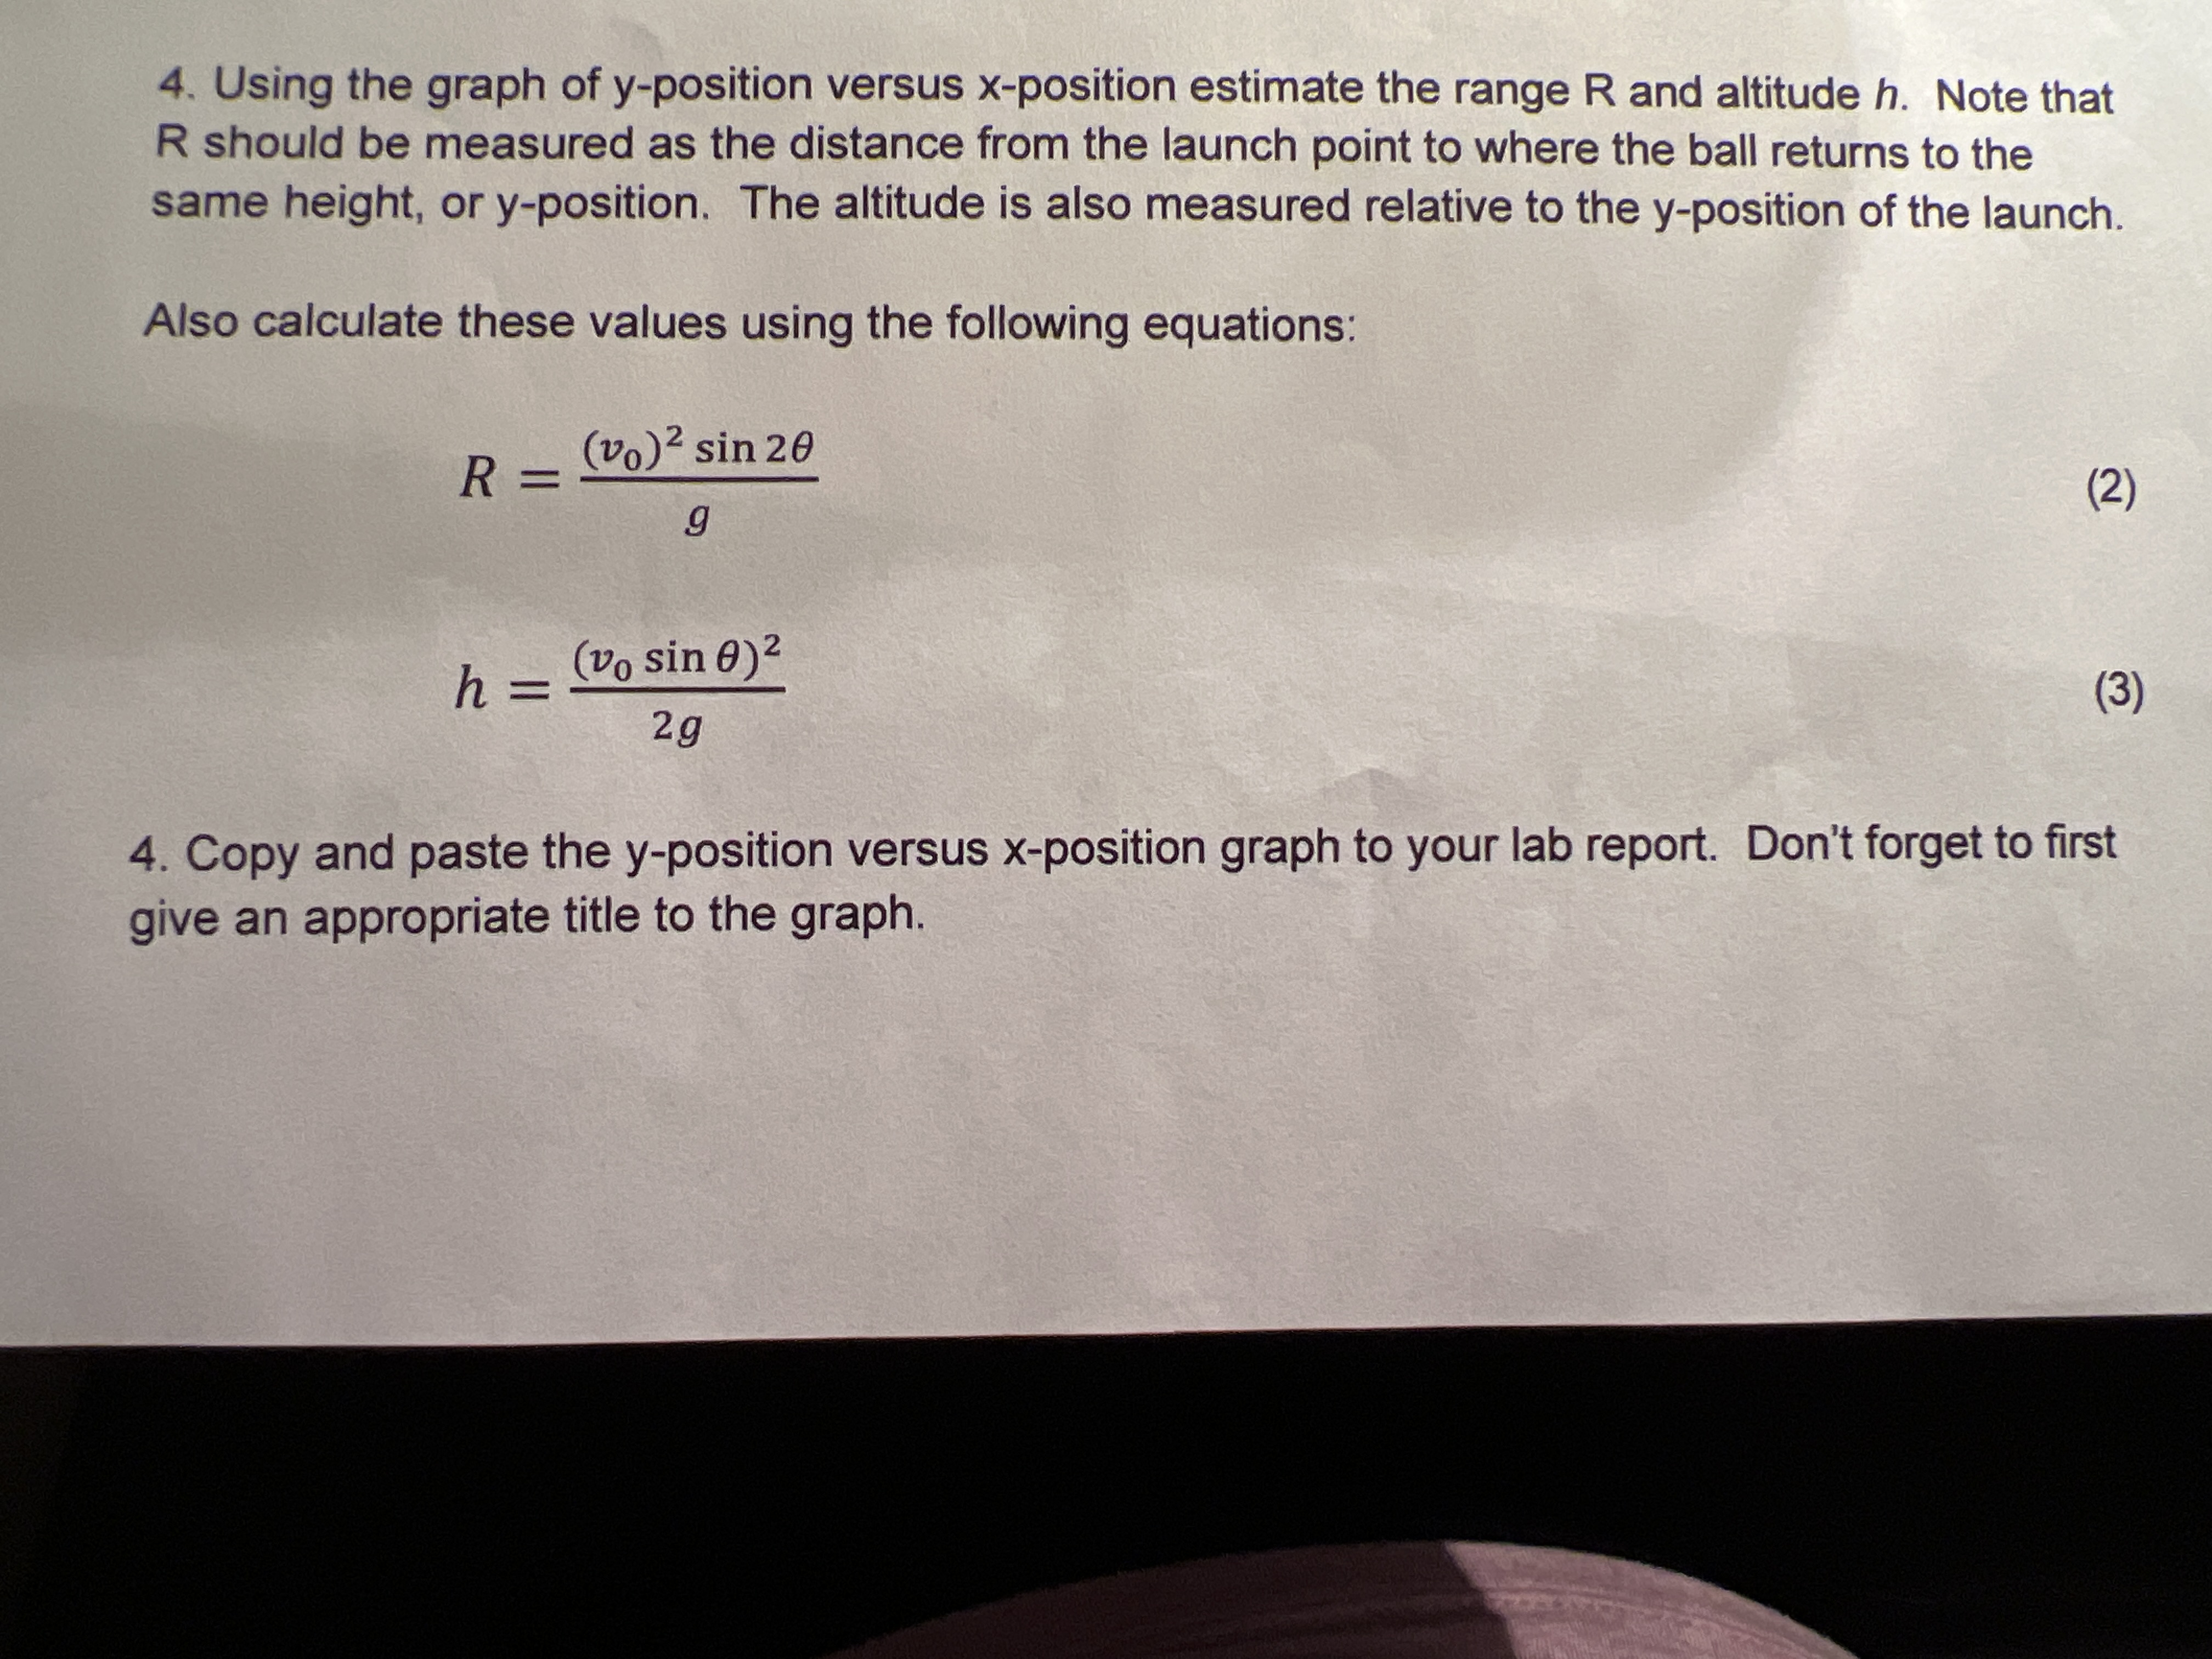
7:d For each launch angle, create a table that contains the values of R and h obtained from the VI eo analysrs and from eqs. (2) and (3). Calculate the percent difference between these values and also include that in each table. DISCUSSION OF DATA ANALYSIS QUESTIONS: Make sure all of your gures and tables are numbered prior to starting this section. Graphs should start with Figure 1, Figure 2, etc., and tables as Table 1, Table 2, etc. 1. Discuss the differences between the measured and calculated values of R and h that are shown In your tables. Did one method consistently yield smaller values than the other? If so, give possmle reasons for the discrepancies. Hint: think about factors from the free fall experiment. 2. Discuss possible sources of error in your measurement of initial launch velocity and how that could affect the calculated values of R and h. 3. For each launch angle, discuss the shape of the curves of y-position vs. time and x-position vs. time. How close did they follow the tracked trajectories? 4. Compare these equations to the general equations for projectile motion: x = (Va c036) t y = (vosinH) t 1g2 Based on the coefcients in your curve t, can you calculate the value of g? If so, what is it and how does it compare to the theoretical value? 4. Using the graph of y-position versus x-position estimate the range R and altitude h. Note that R should be measured as the distance from the launch point to where the ball returns to the same height, or y-position. The altitude is also measured relative to the y-position of the launch. Also calculate these values using the following equations: R = (vo)2 sin 20 (2) g h = (vo sin 0)2 (3) 2g4. Using the graph of y-position versus x-position estimate the range R and altitude h. Note that R should be measured as the distance from the launch point to where the ball returns to the same height, or y-position. The altitude is also measured relative to the y-position of the launch. Also calculate these values using the following equations: = (v0)2 sin 26 g R (2) u 6 2 h = (170 sm ) (3) 29 4. Copy and paste the y-position versus x-position graph to your lab report. Don't forget to rst give an appropriate title to the graph