

Question
Hi! I have a quick question for my statistics class. I have all of my data from the program I am using but I am
Hi! I have a quick question for my statistics class. I have all of my data from the program I am using but I am unsure of how to explain the data I've collected. It also says tabular beside hypothesis and I want to make sure that I set up the table correctly.
Hypothesis (tabular):
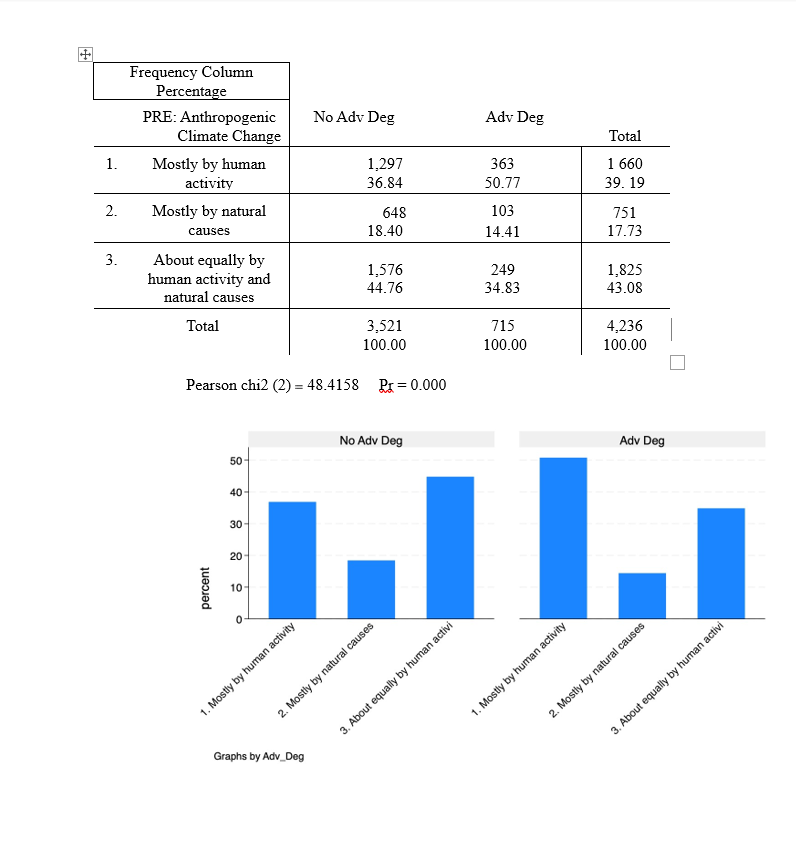
"In comparing individuals, those who hold an advanced educational (start with variable: education) degree be more likely to believe humans are causing climate change (variable: Climate_Change) than those without an advanced degree."
My data:
Step by Step Solution
There are 3 Steps involved in it
Step: 1

Get Instant Access to Expert-Tailored Solutions
See step-by-step solutions with expert insights and AI powered tools for academic success
Step: 2

Step: 3
Ace Your Homework with AI
Get the answers you need in no time with our AI-driven, step-by-step assistance
Get Started
Discrete and Combinatorial Mathematics An Applied Introduction
Authors: Ralph P. Grimaldi
5th edition
201726343, 978-0201726343