

Question
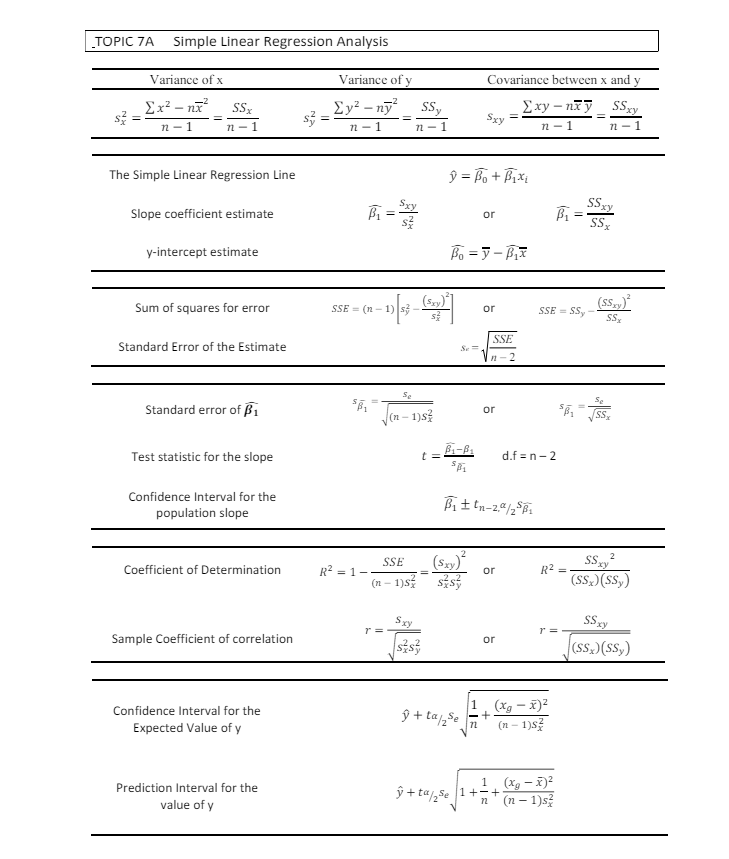
Hi I need help with the following question please (I have attached the formula sheet below) Question 4 A councilor in a new residential area
Hi I need help with the following question please (I have attached the formula sheet below) Question 4
A councilor in a new residential area of outer Western Sydney is reviewing apartment floor areas and sale prices to determine if he could estimate the sale price from the apartment floor area. The area (square metres) and selling price (thousands of dollars) was collected for a sample of 10 recent sales of apartments as follows:
| Area (m2) | 460 | 500 | 540 | 540 | 580 | 610 | 620 | 680 | 730 | 790 |
| Price ($'000s) | 230 | 236 | 242 | 246 | 200 | 250 | 256 | 262 | 250 | 274 |
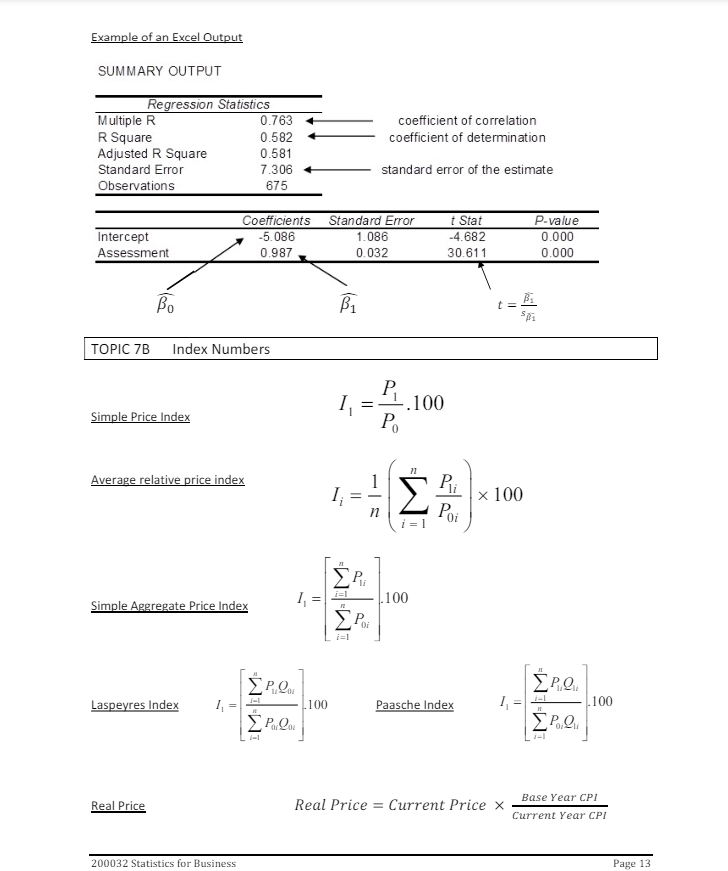
The following partial Excel output was determined.
| Coeff | Stand Error | t Stat | P-value | ||
| Intercept | 170.701 | 32.628 | 5.232 | 0.001 | |
| Area (m) | 0.122 | 0.053 | 2.295 | 0.051 |
(a) What is the equation of the regression line to predict sale price from floor area?
(b) What does the model predict will be the sale price of a comparable apartment in the same location with a floor area of 750 m?
Step by Step Solution
There are 3 Steps involved in it
Step: 1

Get Instant Access to Expert-Tailored Solutions
See step-by-step solutions with expert insights and AI powered tools for academic success
Step: 2

Step: 3
Ace Your Homework with AI
Get the answers you need in no time with our AI-driven, step-by-step assistance
Get Started
A Survey of Mathematics with Applications
Authors: Allen R. Angel, Christine D. Abbott, Dennis Runde
10th edition
134112105, 134112342, 9780134112343, 9780134112268, 134112261, 978-0134112107