Hi, I only need help with the 3rd part please. It would be very appreciated.
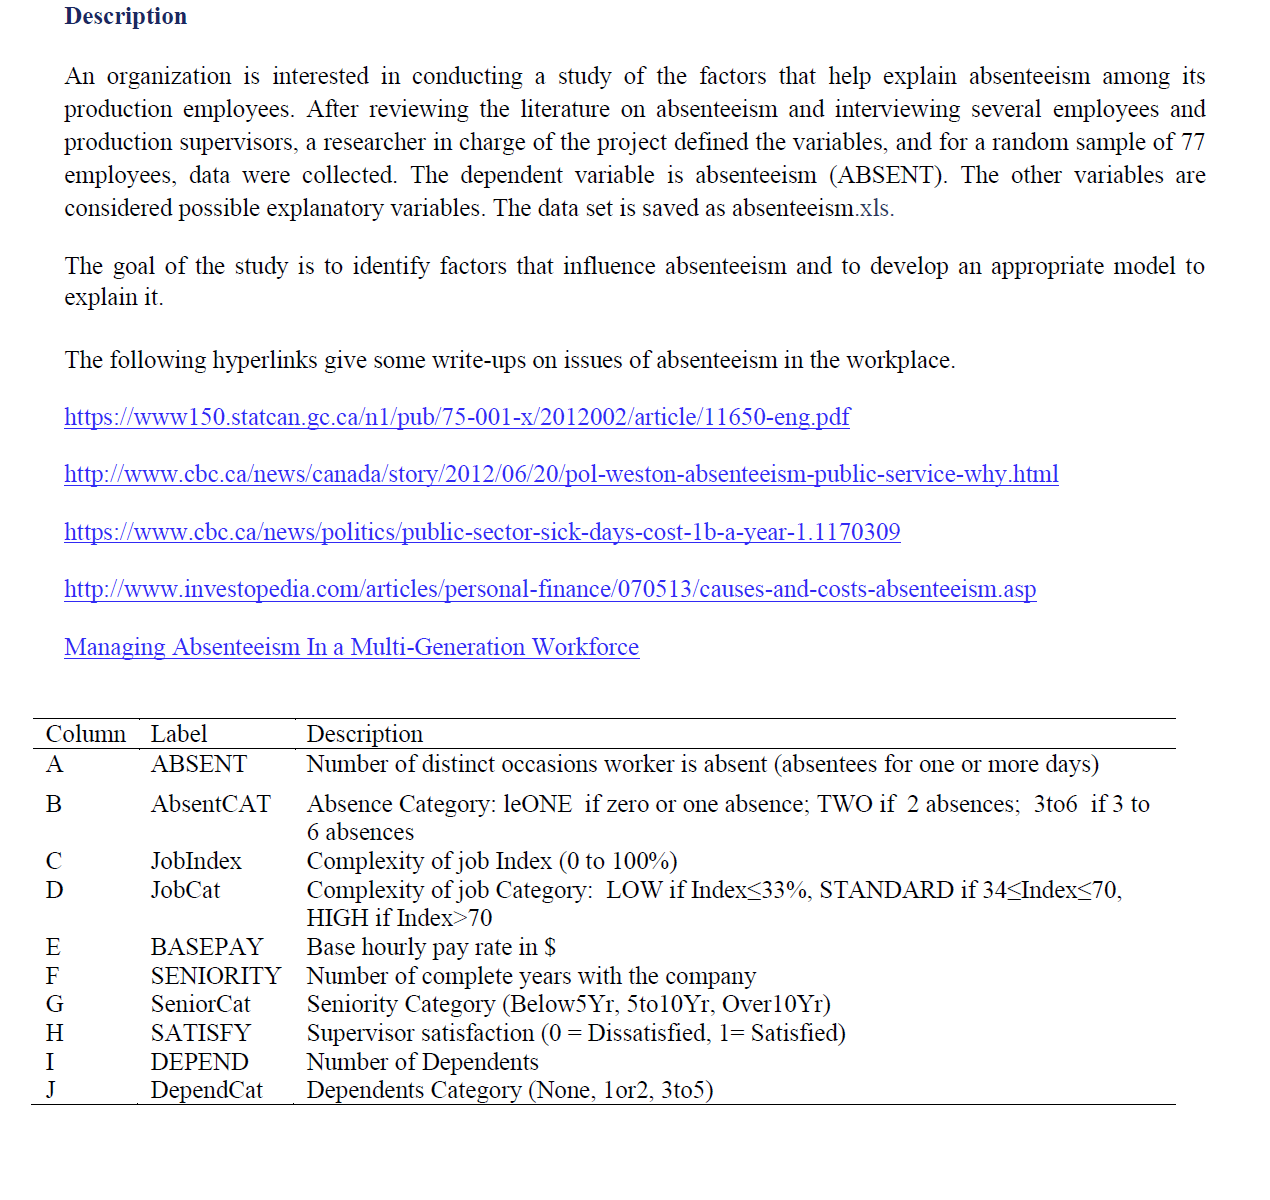
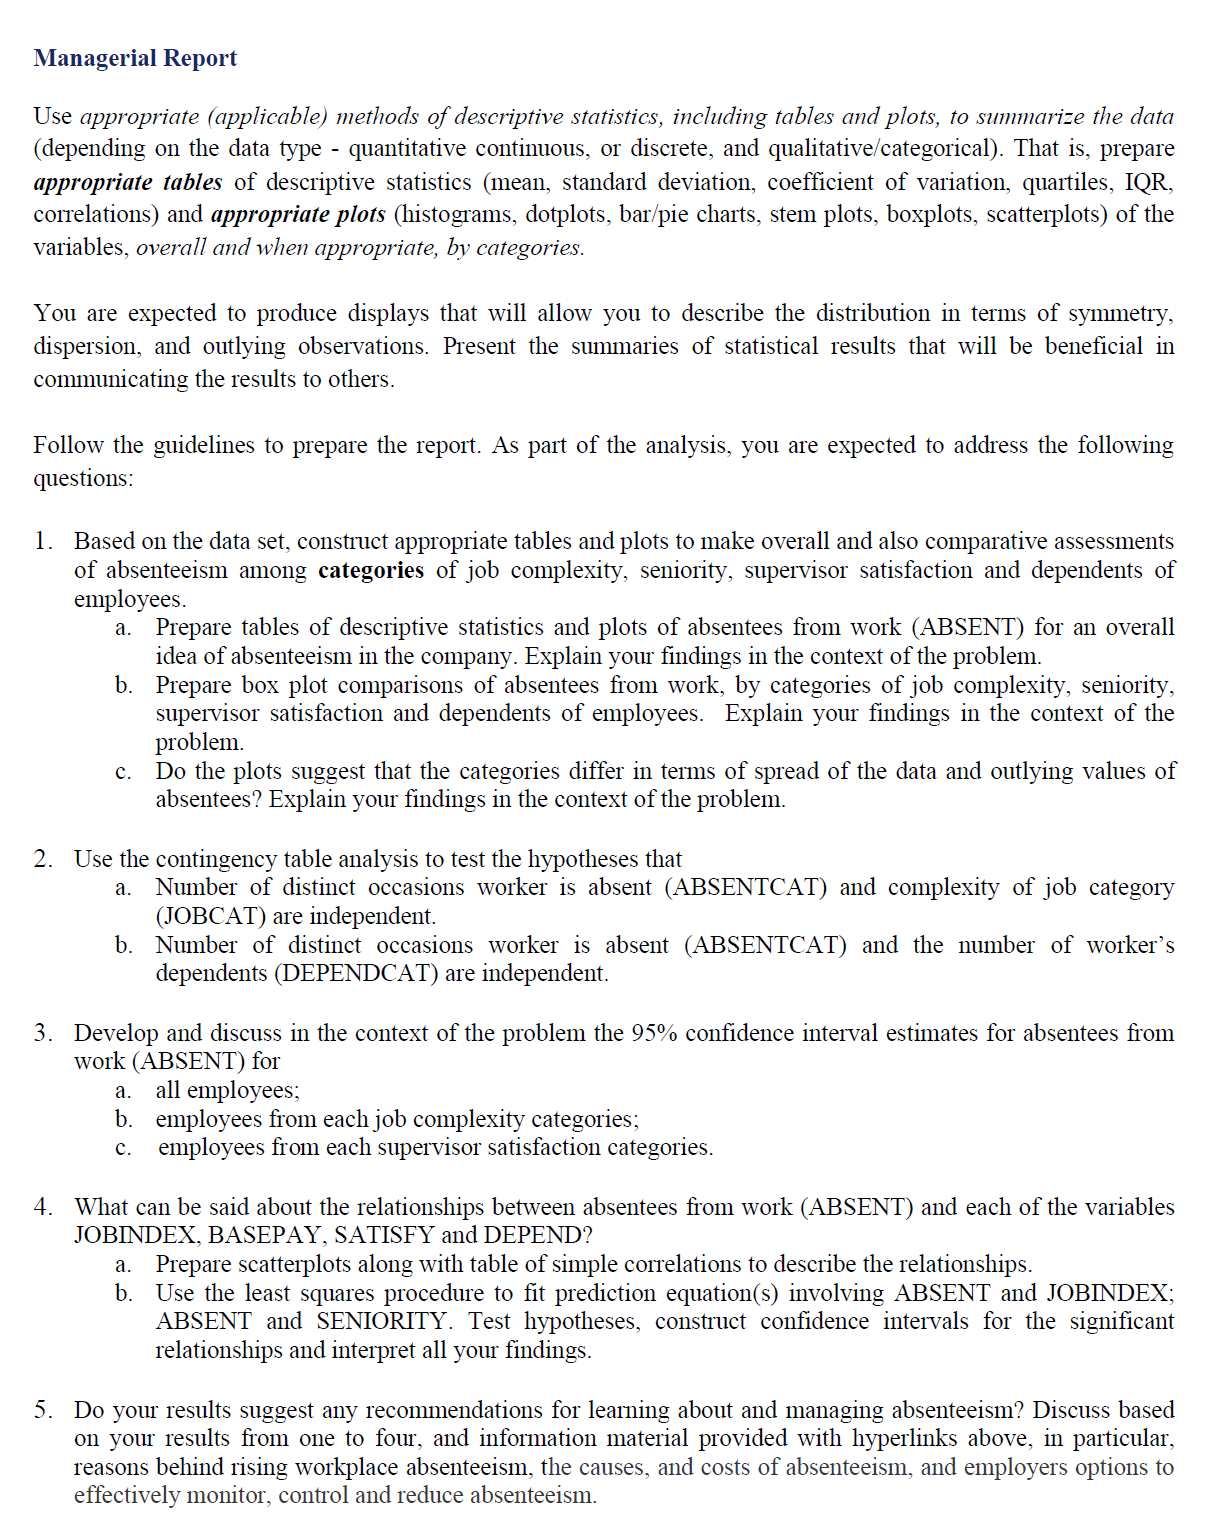
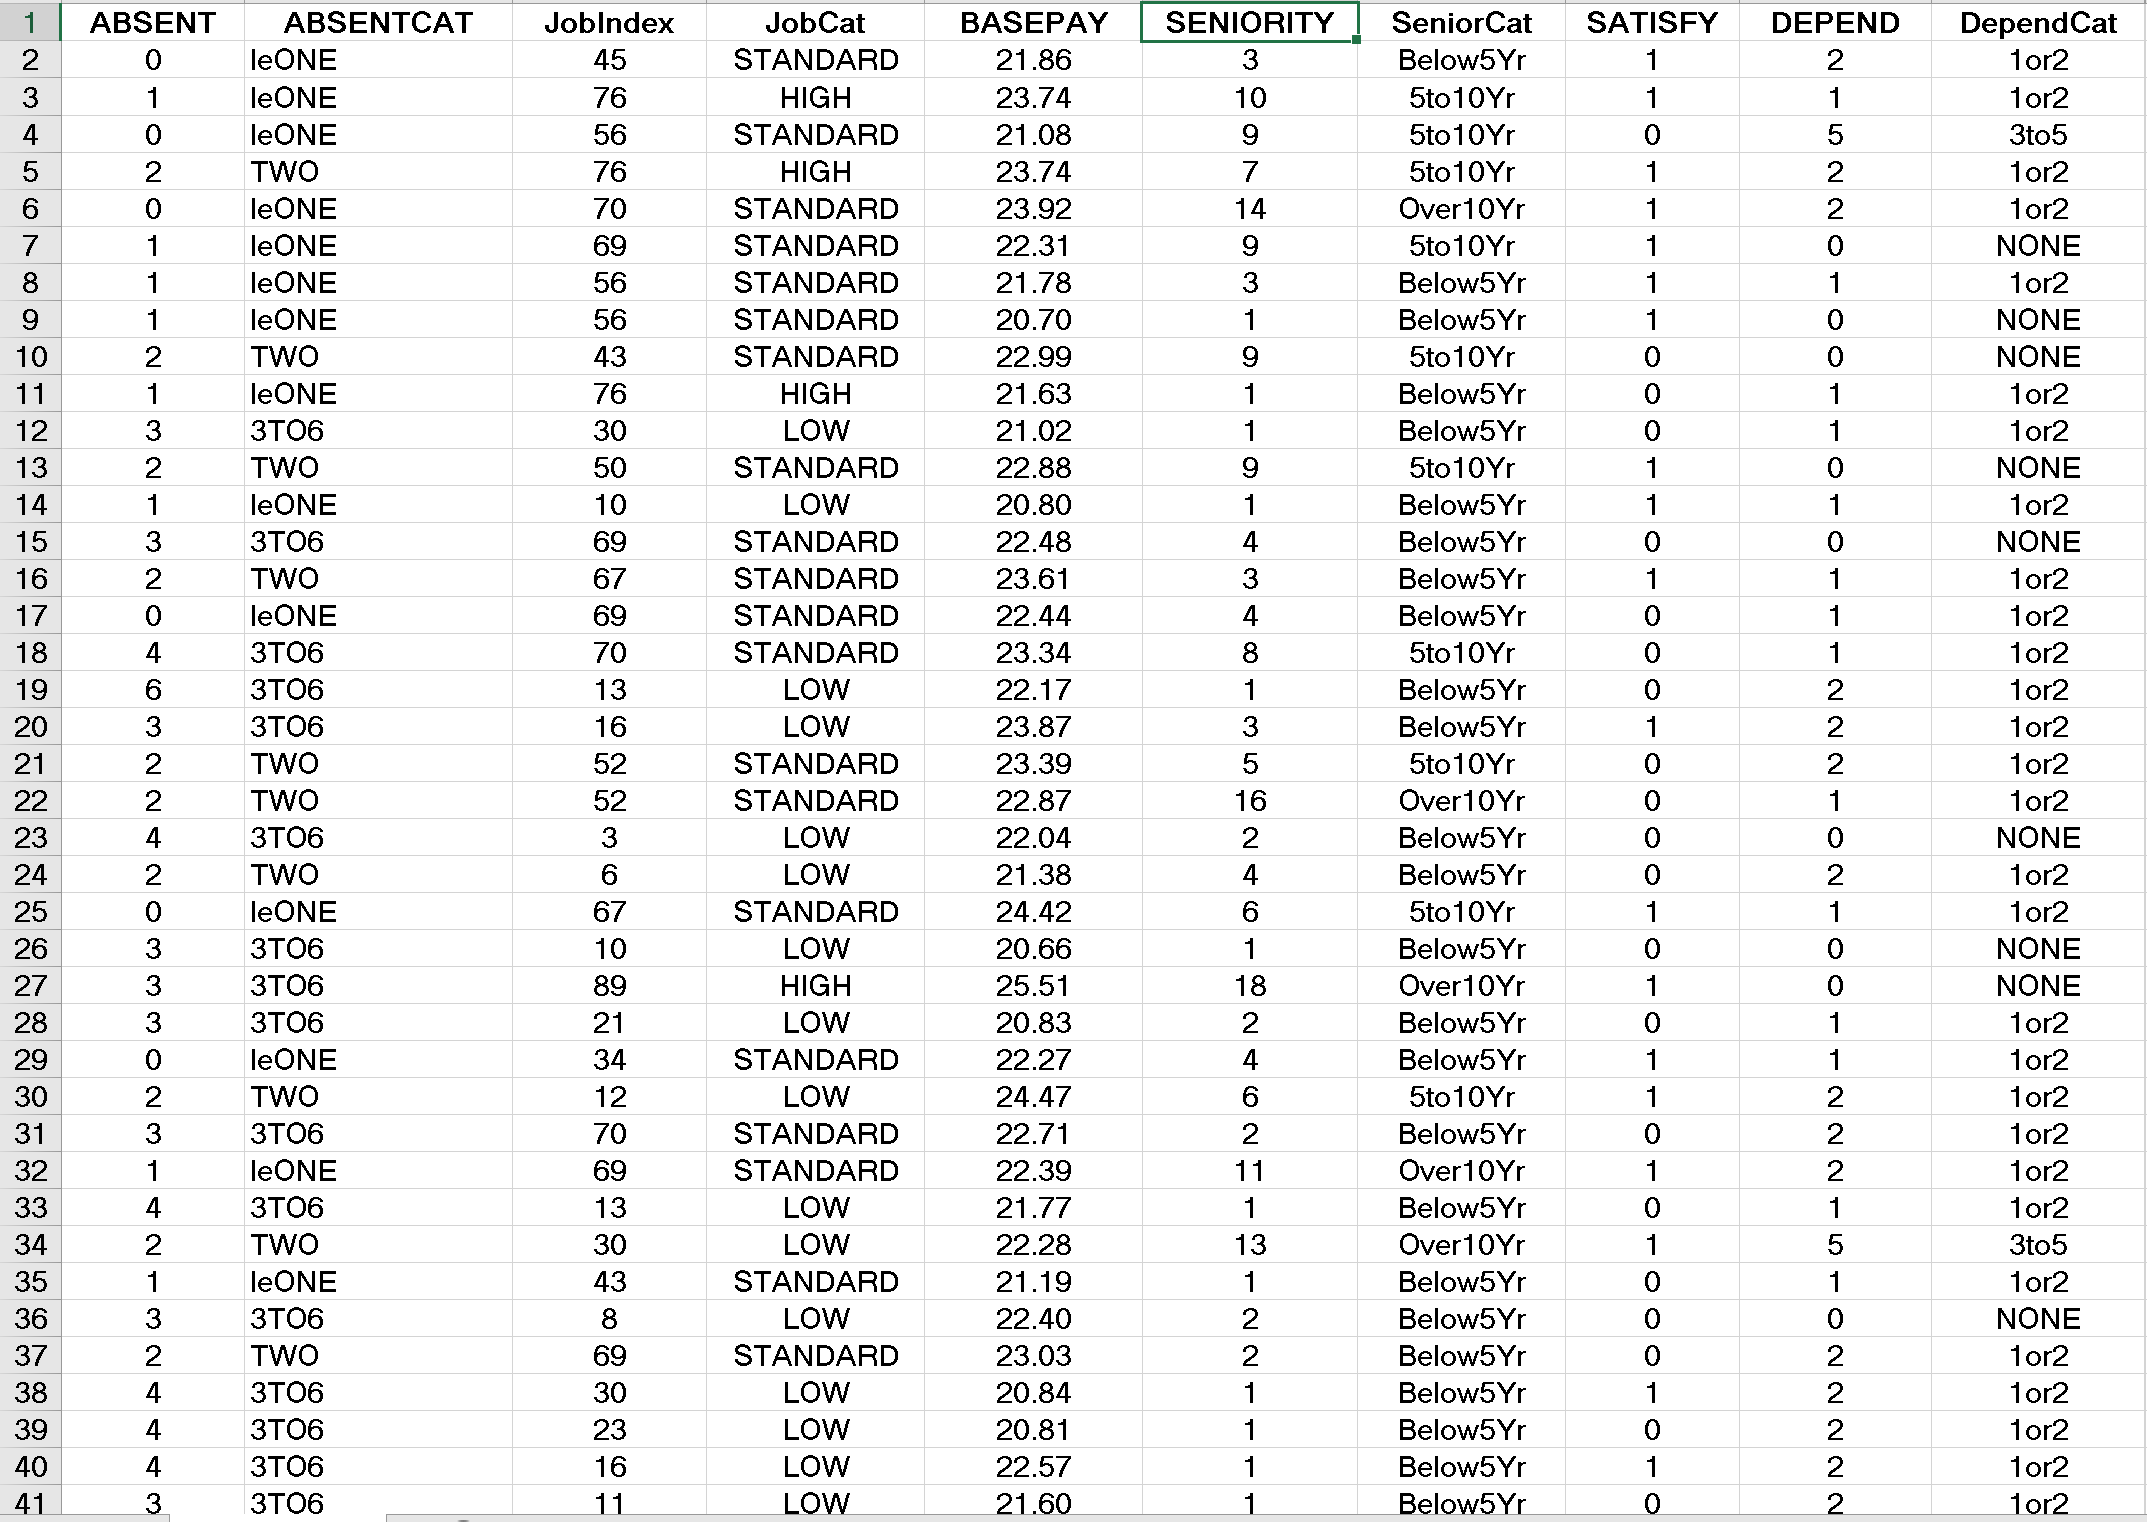
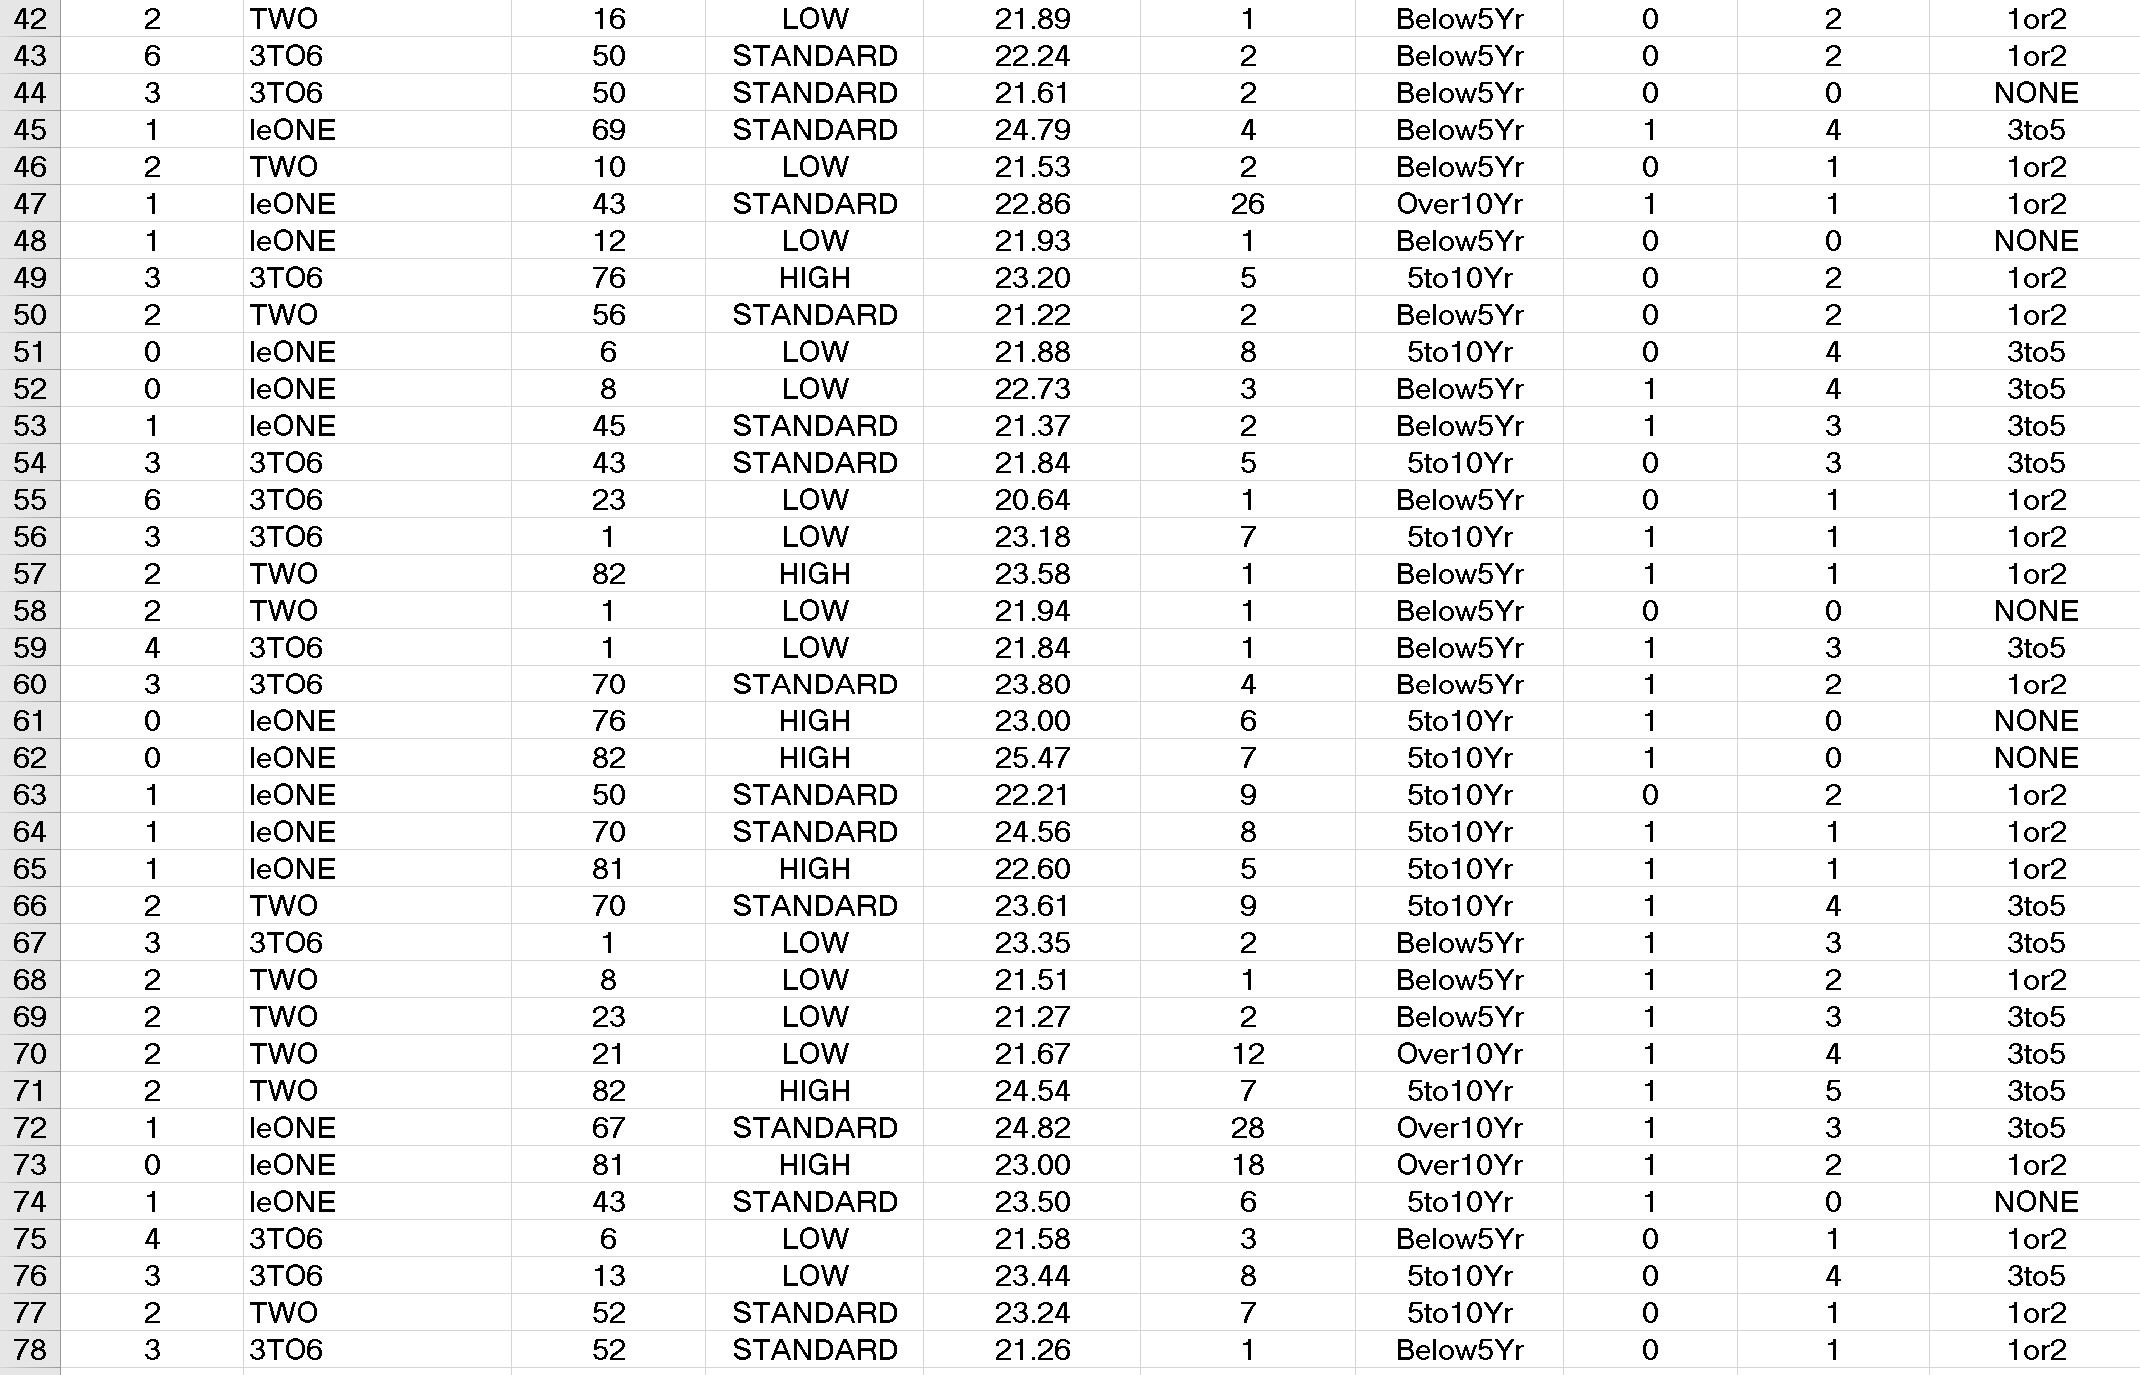
Description An organization is interested in conducting a study of the factors that help explain absenteeism among its production employees. After reviewing the literature on absenteeism and interviewing several employees and production supervisors, a researcher in charge of the project defined the variables, and for a random sample of 77 employees, data were collected. The dependent variable is absenteeism (ABSENT). The other variables are considered possible explanatory variables. The data set is saved as absenteeism.xls. The goal of the study is to identify factors that influence absenteeism and to develop an appropriate model to explain it. The following hyperlinks give some write-ups on issues of absenteeism in the workplace. https://www150.statcan.gc.ca1/pub/75-001-x/2012002/article/11650-eng.pdf http://www.cbc.caews/canada/story/2012/06/20/pol-weston-absenteeism-public-service-why.html https://www.cbc.caews/politics/public-sector-sick-days-cost-1b-a-year-1.1170309 http://www.investopedia.com/articles/personal-finance/070513/causes-and-costs-absenteeism.asp Managing Absenteeism In a Multi-Generation Workforce Column Label Description A ABSENT Number of distinct occasions worker is absent (absentees for one or more days) B AbsentCAT Absence Category: leONE if zero or one absence; TWO if 2 absences; 3to6 if 3 to 6 absences JobIndex Complexity of job Index (0 to 100%) JobCat Complexity of job Category: LOW if Index70 BASEPAY Base hourly pay rate in $ SENIORITY Number of complete years with the company SeniorCat Seniority Category (Below5 Yr, 5to10Yr, Over10Yr) SATISFY Supervisor satisfaction (0 = Dissatisfied, 1= Satisfied) DEPEND Number of Dependents DependCat Dependents Category (None, 1or2, 3to5)Managerial Report Use appropriate (applicable) methods of descriptive statistics, including tables and plots, to summarize the data (depending on the data type - quantitative continuous, or discrete, and qualitative/categorical). That is, prepare appropriate tables of descriptive statistics (mean, standard deviation, coefcient of variation, quartiles, IQR, correlations) and appropriate plots (histograms, dotplots, bar/pie charts, stem plots, boxplots, scatterplots) of the variables, overall and when appropriate, by categories. You are expected to produce displays that will allow you to describe the distribution in terms of symmetry, dispersion, and outlying observations. Present the summaries of statistical results that will be benecial in communicating the results to others. Follow the guidelines to prepare the report. As part of the analysis, you are expected to address the following questions: 1. Based on the data set, construct appropriate tables and plots to make overall and also comparative assessments of absenteeism among categories of job complexity, seniority, supervisor satisfaction and dependents of employees. a. Prepare tables of descriptive statistics and plots of absentees from work (ABSENT) for an overall idea of absenteeism in the company. Explain your ndings in the context of the problem. b. Prepare box plot comparisons of absentees from work, by categories of job complexity, seniority, supervisor satisfaction and dependents of employees. Explain your ndings in the context of the problem. c. Do the plots suggest that the categories differ in terms of spread of the data and outlying values of absentees? Explain your ndings in the context of the problem. Use the contingency table analysis to test the hypotheses that a. Number of distinct occasions worker is absent (ABSENTCAT) and complexity of job category (J OBCAT) are independent. b. Number of distinct occasions worker is absent (ABSENTCAT) and the number of worker's dependents (DEPENDCAT) are independent. Develop and discuss in the context of the problem the 95% condence interval estimates for absentees from work (ABSENT) for a. all employees; b. employees from each job complexity categories; c. employees from each supervisor satisfaction categories. What can be said about the relationships between absentees from work (ABSENT) and each of the variables JOBINDEX, BASEPAY. SATISFY and DEFEND? a. Prepare scatteiplots along with table of simple correlations to describe the relationships. b. Use the least squares procedure to fit prediction equation(s) involving ABSENT and JOBlNDEX; ABSENT and SENTORITY. Test hypotheses, constiuct condence intervals for the signicant relationships and interpret all your ndings. Do your results suggest any recommendations for learning about and managing absenteeism? Discuss based on your results from one to four, and information material provided with hyperlinks above, in particular, reasons behind rising workplace absenteeism, the causes, and costs of absenteeism, and employers options to effectively monitor, control and reduce absenteeism. ABSENT ABSENTCAT JobIndex JobCat BASEPAY SENIORITY SeniorCat SATISFY DEPEND Depend Cat O leONE 45 STANDARD 21.86 3 Below5Yr 2 1or2 leONE 76 HIGH 23.74 10 5to 10Yr 1or2 leONE 56 STANDARD 21.08 9 5to10Yr 3to5 NNO- - ONO - TWO 76 HIGH 23.74 7 5to10Yr 1or2 leONE 70 STANDARD 23.92 14 Over10Yr 1or2 leONE 69 STANDARD 22.31 9 5to 10Yr NONE leONE 56 STANDARD 21.78 Below5Yr 1or2 leONE 56 STANDARD 20.70 60 - W Below5Yr NONE TWO 43 STANDARD 22.99 5to10Yr NONE leONE 76 HIGH 21.63 Below5Yr 1or2 W - NW- N- . 3TO6 30 LOW 21.02 Below5Yr 1or2 TWO 50 STANDARD 22.88 5to10Yr NONE leONE 10 LOW 20.80 Below5Yr 1or2 3TO6 69 STANDARD 22.48 Below5Yr NONE TWO 67 STANDARD 23.61 Below5Yr 1or2 17 leONE 69 STANDARD 22.44 Below5Yr 1or2 3TO6 70 STANDARD 23.34 5to 10Yr 1or2 N N - - - 19 3TO6 13 LOW 22.17 Below5Yr 1or2 3TO6 16 LOW 23.87 Below5Yr 1or2 TWO 52 STANDARD 23.39 5to 10Yr 1or2 TWO 52 STANDARD 22.87 16 Over10Yr 1or2 23 3TO6 3 LOW 22.04 2 Below5Yr NONE WNOWWWONANNWODON 24 TWO 6 LOW 21.38 4 Below5Yr 1or2 25 leONE 67 STANDARD 24.42 6 5to 10Yr 1or2 3TO6 10 LOW 20.66 Below5Yr -o-o-0-0- -0-0-060-060-0 - -0 NONE oo- 3TO6 89 HIGH 25.51 18 Over10Yr NONE 28 3TO6 21 LOW 20.83 2 Below5Yr 1or2 leONE 34 STANDARD 22.27 4 Below5Yr 1or2 TWO 12 LOW 24.47 6 5to 10Yr 1or2 3TO6 70 STANDARD 22.71 2 Below5Yr 1or2 32 leONE 69 STANDARD 22.39 11 Over10Yr 1or2 33 3TO6 13 LOW 21.77 1 Below5Yr 1or2 34 TWO 30 LOW 22.28 13 Over10Yr 3to5 +NW- NA- leONE 43 STANDARD 21.19 1 UNNNNO-U-NNN-. 35 Below5Yr 1or2 36 3TO6 8 LOW 22.40 Below5Yr NONE NN 37 TWO 69 STANDARD 23.03 Below5Yr 1or2 38 3TO6 30 LOW 20.84 Below5Yr 1or2 39 3TO6 23 LOW 20.81 Below5Yr 1or2 40 3TO6 16 LOW 22.57 Below5Yr 1or2 41 3 3TO6 11 LOW 21.60 Below5Yr 1or242 TWO 16 LOW 21.89 Below5 Yr 1or2 43 3TO6 50 STANDARD 22.24 Below5Yr 1or2 44 3TO6 50 STANDARD 21.61 NANN- Below5Yr NONE 45 - - N - WON leONE 69 STANDARD 24.79 Below5Yr 3to5 46 TWO 10 LOW 21.53 Below5Yr 1or2 47 leONE 43 STANDARD 22.86 26 Over10Yr 1or2 48 leONE 12 LOW 21.93 Below5Yr NONE - W W AA N NO- - PONN 49 3TO6 76 HIGH 23.20 5to 10Yr 1or2 50 TWO 56 STANDARD 21.22 Below5Yr 1or2 51 leONE 6 LOW 21.88 5to10Yr 3to5 Ow-OONW-. 52 leONE 8 LOW 22.73 V- ONWONG- Below5Yr 3to5 53 leONE 45 STANDARD 21.37 Below5Yr 3to5 54 3TO6 43 STANDARD 21.84 5to 10Yr 3to5 55 3TO6 23 LOW 20.64 Below5Yr 1or2 56 3TO6 1 LOW 23.18 5to 10Yr 1or2 57 NNW TWO 82 HIGH 23.58 Below5Yr 1or2 58 TWO 1 LOW 21.94 Below5Yr NONE 59 3TO6 1 LOW 21.84 Below5Yr 3to5 3TO6 70 STANDARD 23.80 Below5Yr boo O - JJJJaJaj4 4 04 4 4 -0 420 0 - -060 0-0-0 0 0 1or2 61 leONE 76 HIGH 23.00 5to10Yr NONE 62 leONE 82 HIGH 25.47 5to 10Yr NONE - NOOOOVOA--- 63 leONE 50 STANDARD 22.21 5to10Yr 1or2 64 leONE 70 STANDARD 24.56 5to10Yr 1or2 ONWUAWNWA-- NOONWO-- 65 leONE 81 HIGH 22.60 5to10Yr 1or2 8 O - N N N N W N - - -OO WP TWO 70 STANDARD 23.61 5to10Yr 3to5 3TO6 1 LOW 23.35 Below5Yr 3to5 TWO 8 LOW 21.51 Below5Yr 1or2 69 TWO 23 LOW 21.27 2 Below5Yr 3to5 TWO 21 LOW 21.67 12 Over10Yr 3to5 71 TWO 82 HIGH 24.54 7 5to 10Yr 3to5 72 leONE 67 STANDARD 24.82 28 Over10Yr 3to5 73 leONE 81 HIGH 23.00 18 Over10Yr 1or2 74 leONE 43 STANDARD 23.50 6 5to 10Yr NONE 75 3TO6 6 LOW 21.58 3 Below5Yr 1or2 WNWA- 76 3TO6 13 LOW 23.44 5to10Yr 3to5 - -A- TWO 52 STANDARD 23.24 5to10Yr 1or2 78 3TO6 52 STANDARD 21.26 Below5Yr 1or2


