Hi. I really need help with this assignment. I submitted the assignment already, and I got feedbacks to solve the mistakes in my first submissions.
I will attach the submission ( The excel file ). Also, the feedbacks that include the mistakes in the excel submission. Please, I only need to fix the mistakes so I can submit the second submission today so my professor take the higher grade. Thanks for your time I really appreciate it! ( PLEASE HELP)
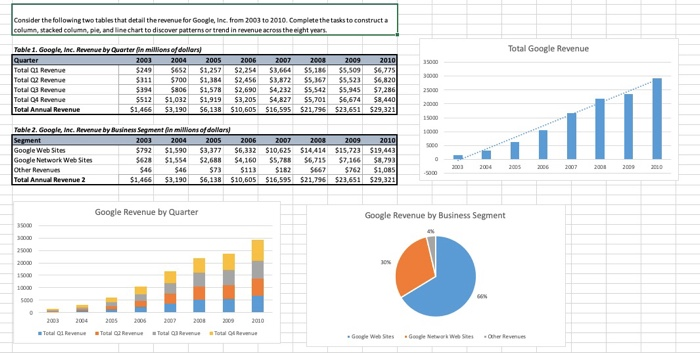
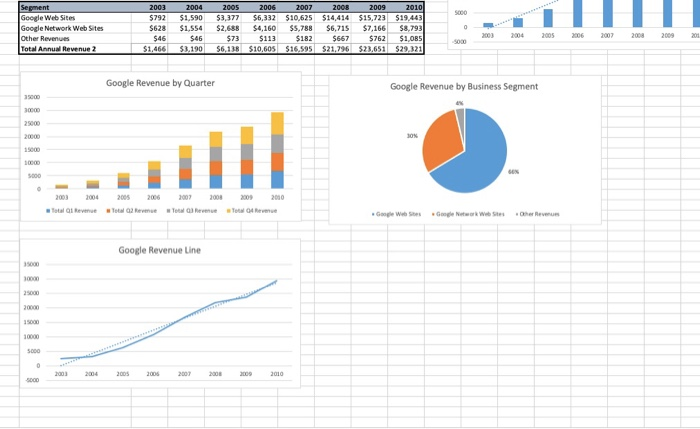
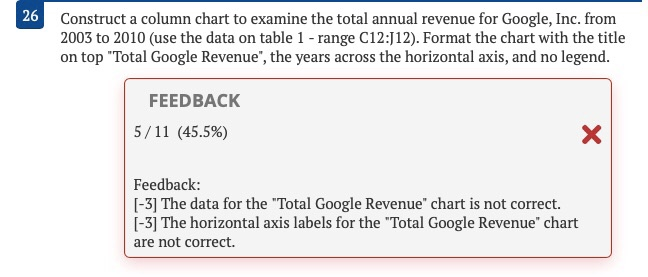
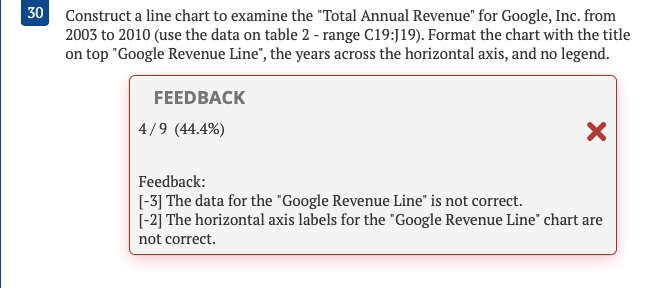
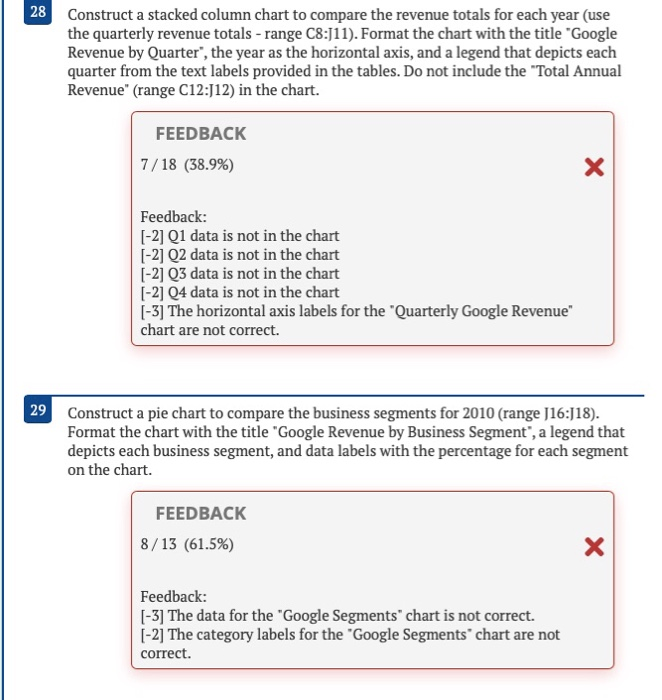
Consider the following two tables that detail the revenue for Google, Inc. from 2003 to 2010. Complete the tasks to constructa column, stacked column, ple, and line chart to discover patterns or trend in revenue across the eight years Total Google Revenue Quarter Table 1. Google, Inc. Aenwe by Quarter in millions of dollars) 2003 2004 2005 Total Revenue $249 $652 $1,257 Total Revenue $311 $700 $1,384 Total Q3 Revenue $394 $806 $1,578 Total 04 Revenue $512 $1,032 $1,919 Total Annual Revenue $1,466 $3,190 $6,138 2006 $2.254 $2,456 $2,690 $3,205 $10,605 2007 $3.664 $3,872 $4,232 $4,827 $16,595 2008 $5,186 $5,367 SS 542 $5,701 $21,795 2009 $5,509 $5,523 $5.945 $6,674 $23,651 2010 56,775 $6,820 $2,286 $8,440 $29,321 Table 2. Google Inc. Are Segment Google Web Sites Google Network Web Sites Other Revenue Total Annual Revenue 2 by Business Segment in ons of dollars) 2003 2004 2005 2006 $792 $1,590 $3,377 $6,332 $628 $1,554 $2,688 $4,160 $46 $73 $113 51,466 $3,190 $6,138 $10,605 2007 $10.625 $5.788 $182 $16,595 2008 $14.414 $6,715 5667 $21,796 2009 $15,723 $7,166 2010 $19,443 $8,793 $1.08S $23,651 $29,321 Google Revenue by Quarter Google Revenue by Business Segment Total Revenue Total Revenue Total Total Gegewebtes Google Sement Google Web Sites Google Network Web Sites Other Revue Total Annu Revenue 2 2003 $792 $628 546 $1.466 2004 $1.590 $1.554 546 $1.190 2005 $3.377 52.683 $73 5 6.13 2006 9 6,332 4,150 5 113 10.50 2007 $10,625 $5,788 $182 16.595 2008 $14.414 $6,715 $667 $21.796 2009 $15.723 $7,166 $752 $23.651 2010 $19.443 $8,793 $10S 529321 Google Revenue by Quarter Google Revenue by Business Segment 2007 2008 2009 2010 Goog ww w Revenum Google Revenue Line 26 Const Construct a column chart to examine the total annual revenue for Google, Inc. from 2003 to 2010 (use the data on table 1 - range C12:12). Format the chart with the title on top "Total Google Revenue", the years across the horizontal axis, and no legend. FEEDBACK 5/11 (45.5%) Feedback: 1-3The data for the "Total Google Revenue" chart is not correct. [-3] The horizontal axis labels for the "Total Google Revenue" chart are not correct. Construct a line chart to examine the "Total Annual Revenue" for Google, Inc. from 2003 to 2010 (use the data on table 2-range C19:J19). Format the chart with the title on top "Google Revenue Line", the years across the horizontal axis, and no legend. FEEDBACK 4/9 (44.4%) Feedback: (-3) The data for the "Google Revenue Line" is not correct. [-2] The horizontal axis labels for the "Google Revenue Line" chart are not correct. Consider the following two tables that detail the revenue for Google, Inc. from 2003 to 2010. Complete the tasks to constructa column, stacked column, ple, and line chart to discover patterns or trend in revenue across the eight years Total Google Revenue Quarter Table 1. Google, Inc. Aenwe by Quarter in millions of dollars) 2003 2004 2005 Total Revenue $249 $652 $1,257 Total Revenue $311 $700 $1,384 Total Q3 Revenue $394 $806 $1,578 Total 04 Revenue $512 $1,032 $1,919 Total Annual Revenue $1,466 $3,190 $6,138 2006 $2.254 $2,456 $2,690 $3,205 $10,605 2007 $3.664 $3,872 $4,232 $4,827 $16,595 2008 $5,186 $5,367 SS 542 $5,701 $21,795 2009 $5,509 $5,523 $5.945 $6,674 $23,651 2010 56,775 $6,820 $2,286 $8,440 $29,321 Table 2. Google Inc. Are Segment Google Web Sites Google Network Web Sites Other Revenue Total Annual Revenue 2 by Business Segment in ons of dollars) 2003 2004 2005 2006 $792 $1,590 $3,377 $6,332 $628 $1,554 $2,688 $4,160 $46 $73 $113 51,466 $3,190 $6,138 $10,605 2007 $10.625 $5.788 $182 $16,595 2008 $14.414 $6,715 5667 $21,796 2009 $15,723 $7,166 2010 $19,443 $8,793 $1.08S $23,651 $29,321 Google Revenue by Quarter Google Revenue by Business Segment Total Revenue Total Revenue Total Total Gegewebtes Google Sement Google Web Sites Google Network Web Sites Other Revue Total Annu Revenue 2 2003 $792 $628 546 $1.466 2004 $1.590 $1.554 546 $1.190 2005 $3.377 52.683 $73 5 6.13 2006 9 6,332 4,150 5 113 10.50 2007 $10,625 $5,788 $182 16.595 2008 $14.414 $6,715 $667 $21.796 2009 $15.723 $7,166 $752 $23.651 2010 $19.443 $8,793 $10S 529321 Google Revenue by Quarter Google Revenue by Business Segment 2007 2008 2009 2010 Goog ww w Revenum Google Revenue Line 26 Const Construct a column chart to examine the total annual revenue for Google, Inc. from 2003 to 2010 (use the data on table 1 - range C12:12). Format the chart with the title on top "Total Google Revenue", the years across the horizontal axis, and no legend. FEEDBACK 5/11 (45.5%) Feedback: 1-3The data for the "Total Google Revenue" chart is not correct. [-3] The horizontal axis labels for the "Total Google Revenue" chart are not correct. Construct a line chart to examine the "Total Annual Revenue" for Google, Inc. from 2003 to 2010 (use the data on table 2-range C19:J19). Format the chart with the title on top "Google Revenue Line", the years across the horizontal axis, and no legend. FEEDBACK 4/9 (44.4%) Feedback: (-3) The data for the "Google Revenue Line" is not correct. [-2] The horizontal axis labels for the "Google Revenue Line" chart are not correct