Answered step by step
Verified Expert Solution
Link Copied!

Question

1 Approved Answer

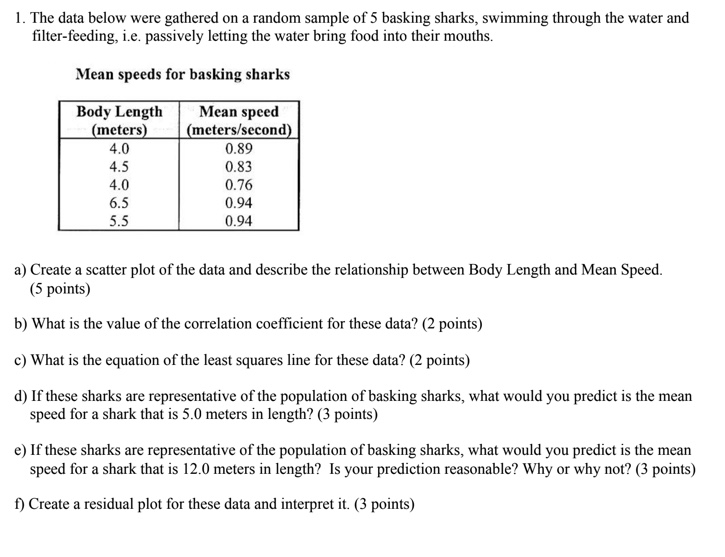
Hi, I was wondering if anyone can help me with this problem. Thank you! 1. The data below were gathered on a random sample of

Hi,

I was wondering if anyone can help me with this problem.

Thank you!

image text in transcribed
1. The data below were gathered on a random sample of 5 basking sharks, swimming through the water and filter-feeding, i.e. passively letting the water bring food into their mouths. Mean speeds for basking sharks Body Length Mean speed meters metersfsecnnd a] Create a scatter plot of" the data and describe the relationship between Body length and Mean Speed. (5 points) b) 1|What is the value of the correlation coefcient for these data? {2 points] c) What is the equation of the least squares line for these data\";I (2 points} d) If these sharks are representative of the population of basking sharks, what would you predict is the mean speed for a shark that is St] meters in length\"? [3 points} e) If these sharks are representative of the population of basking sharks, what would you predict is the mean speed for a shark that is 121] meters in length? Is your prediction reasonable? Why or why not? (3 points} 1'] Create a residual plot for these data and interpret it. {3 points]

Step by Step Solution

There are 3 Steps involved in it

Step: 1

blur-text-image

Get Instant Access to Expert-Tailored Solutions

See step-by-step solutions with expert insights and AI powered tools for academic success

Step: 2

blur-text-image

Step: 3

blur-text-image

Ace Your Homework with AI

Get the answers you need in no time with our AI-driven, step-by-step assistance

Get Started

Recommended Textbook for

A First Course in Differential Equations with Modeling Applications

Authors: Dennis G. Zill

11th edition

1305965728, 978-1305965720

More Books

Students also viewed these Mathematics questions

Question

What is operatiing system?

Answered: 1 week ago