

Question
Hi! If someone could help me with this section of my statistics homework I would greatly appreciate it. I am doing a regression analysis for
Hi! If someone could help me with this section of my statistics homework I would greatly appreciate it. I am doing a regression analysis for the 2016 & 2020 election. I have already made my regression analysis tables but I am unsure of how to answer the questions below:
Part 2: Regression Analysis
- Perform three bivariate regressions, one where you predict Biden vote share as a function of Clinton's 2016 vote share, one where you predict Trump's 2020 vote share as a function of Trump's 2016 vote share, and a third where you predict other candidate vote share in 2020 as a function of other candidate vote share in 2016. Make sure you report the tables in your write up.
- Report the direction and magnitude of effects, strength of relationship, and accept or reject the null hypothesis of no effect
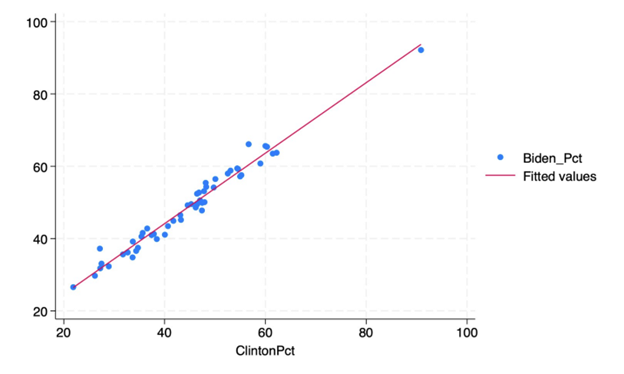
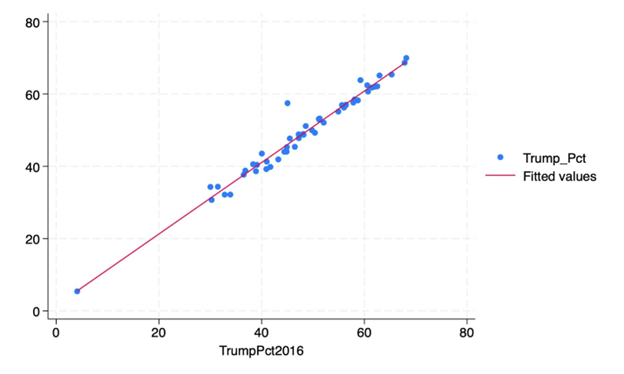
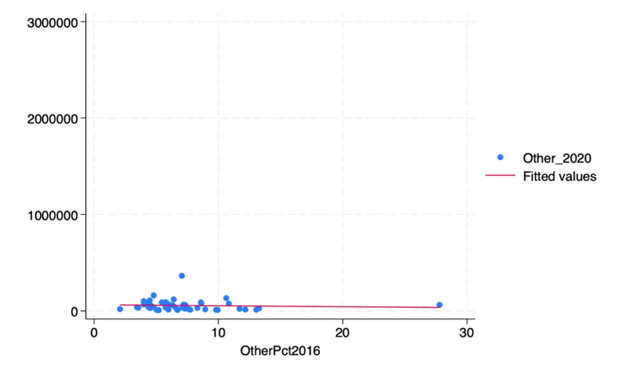
- Present three scatter plots with lines of best fit, where the y-axis is the party's 2020 vote share, and the x-axis is the party's 2016 vote share.
Table 2: Biden/Clinton Regression Analysis
| Obs | F (1, 49) | Prob > F | R-Sq. | Adj R_Sq. | Root MSE |
| 51 | 1685.75 | 0.00 | 0.97 | 0.97 | 2.05 |
| Biden Percent | Coefficient | Std. err. | t | P>|t| | [95% conf. interval] | |
Clinton Percent _cons | .98 5.11 | -.02 1.10 | 41.06 4.66 | 0.00 0.00 | .93 2.91 | 1.02 7.32 |
Table 3: Trump Regression Analysis
| Obs | F (1, 49) | Prob > F | R-Sq. | Adj R_Sq. | Root MSE |
| 51 | 1440.28 | 0.00 | 0.97 | 0.97 | 2.20 |
| Trump Percent | Coefficient | Std. err. | t | P>|t| | [95% conf. interval] | |
Trump Percent (2016) _cons | .99 1.47 | .03 1.29 | 37.95 1.14 | 0.00 0.26 | .94 -1.13 | 1.04 4.07 |
Table 4: Other Regression Analysis
| Obs | F (1, 49) | Prob > F | R-Sq. | Adj R_Sq. | Root MSE |
| 51 | 1440.28 | 0.00 | 0.97 | 0.97 | 2.20 |
| Other Percent | Coefficient | Std. err. | t | P>|t| | [95% conf. interval] | |
Other Percent (2016) _cons | -1014.02 63231.84 | 2083.12 16905.87 | -0.49 2.374 | 0.63 0.00 | -5200.21 29258.23 | 3172.16 97205.46 |
Step by Step Solution
There are 3 Steps involved in it
Step: 1

Get Instant Access to Expert-Tailored Solutions
See step-by-step solutions with expert insights and AI powered tools for academic success
Step: 2

Step: 3
Ace Your Homework with AI
Get the answers you need in no time with our AI-driven, step-by-step assistance
Get Started
Statistical Techniques in Business and Economics
Authors: Douglas A. Lind, William G Marchal
17th edition
1259666360, 978-1259666360