Question
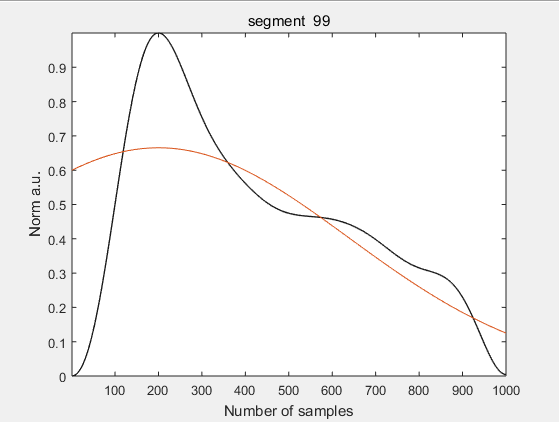
Hi, I'm trying gaussian curve fitting using matlab. I succeeded in segmenting the signal and fitting it into one gaussian curve as follows. However, I
Hi, I'm trying gaussian curve fitting using matlab. I succeeded in segmenting the signal and fitting it into one gaussian curve as follows. However, I am having difficulty fitting with two or more gaussian curves. How do you code it?
clear all; close all; clc; %% load data load('SPR0013_base_waves_allPEAKS.mat'); %% cnt=99;
PPG=DATA.WAVE(:,2); PT=DATA.LPEAK(:,1); PTI=round(PT*300); L=length(PTI);
x=PTI(cnt):PTI(cnt+1); y=PPG(x); x = x-PTI(cnt);
norm_y=((y-min(y)) / (max(y)-min(y))); re_PPG=interpol3(x,norm_y,x(end)); n=[1:1:1000];
plot(re_PPG,'color',[0.1 0.1 0.1],'LineWidth',1); title(['segment ',num2str(cnt)]) xlabel('Number of samples') ylabel('Norm a.u.') axis tight
a= segGaussFit(n, re_PPG, 1, 0)
[yval, yloc] = max(re_PPG(:));
mu =min(n)+yloc; gaumd1 = (a(1).* exp(-(((n-mu).^2)/(2*a(2)^2)))+min(re_PPG)); hold on; plot(gaumd1)

Step by Step Solution
There are 3 Steps involved in it
Step: 1

Get Instant Access to Expert-Tailored Solutions
See step-by-step solutions with expert insights and AI powered tools for academic success
Step: 2

Step: 3

Ace Your Homework with AI
Get the answers you need in no time with our AI-driven, step-by-step assistance
Get Started


