hi just wondering.. would i be able to get answers for following question..
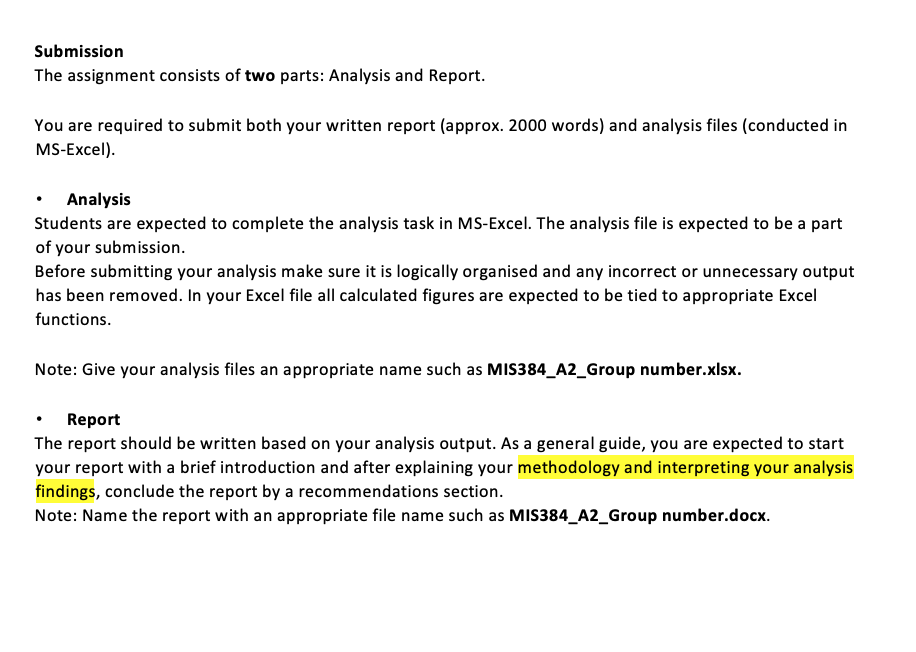
"only the methodology and interpretation section on report" (i have highlighted the requirement on screenshot ). my other group members will finish recommendation and other parts..
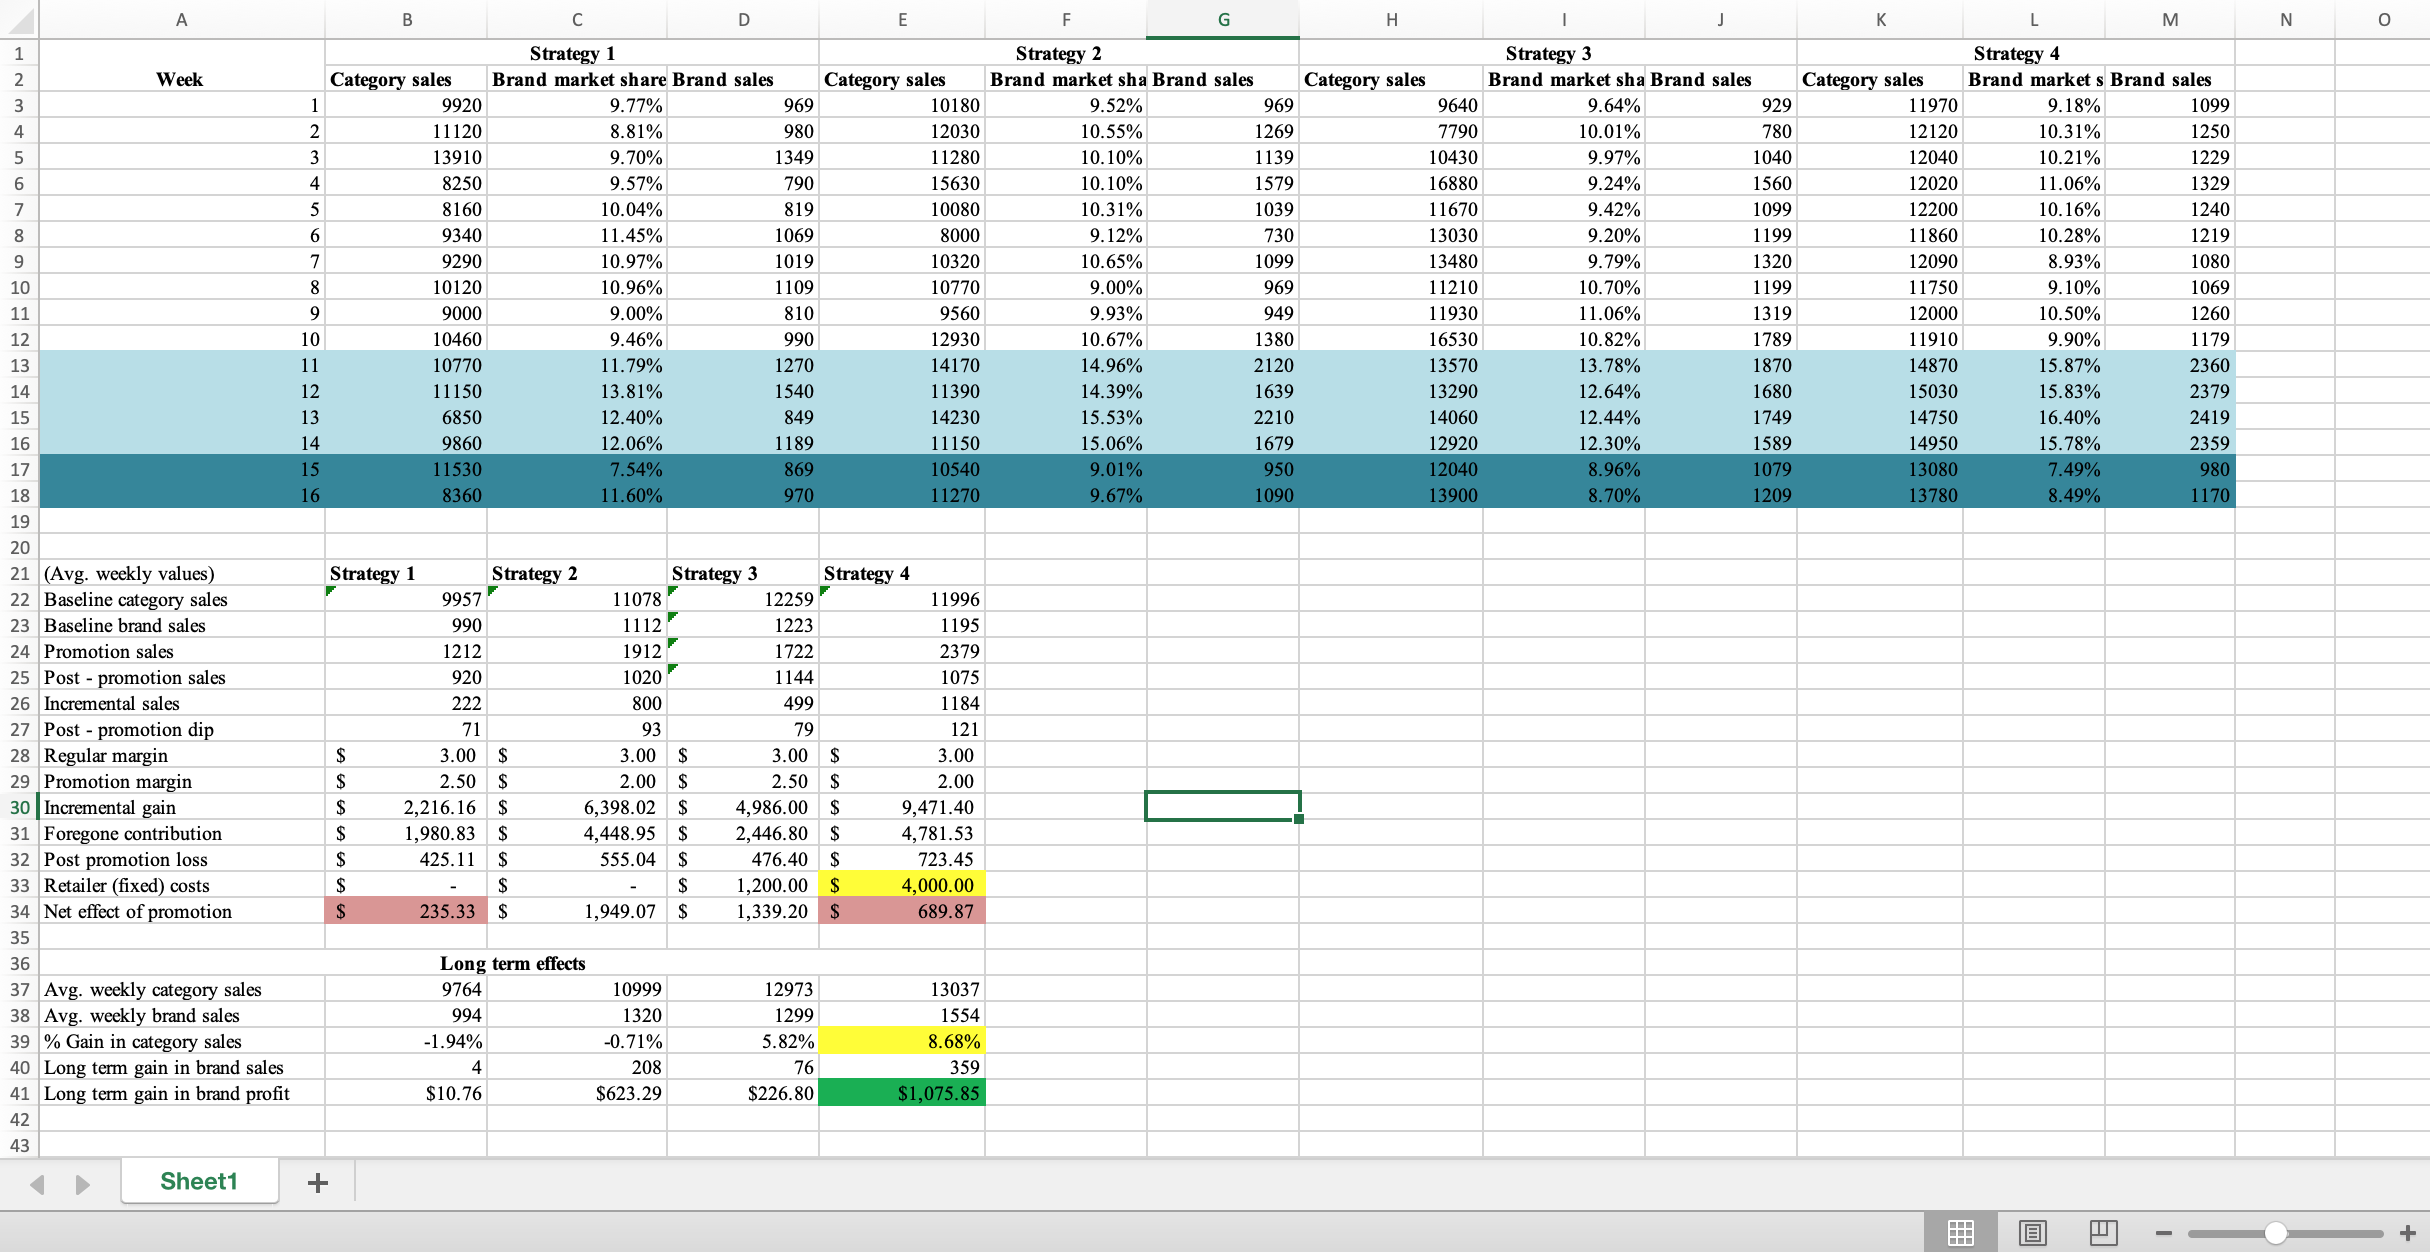
i have done the analysis part on excel and you guys can wright the report based on it..
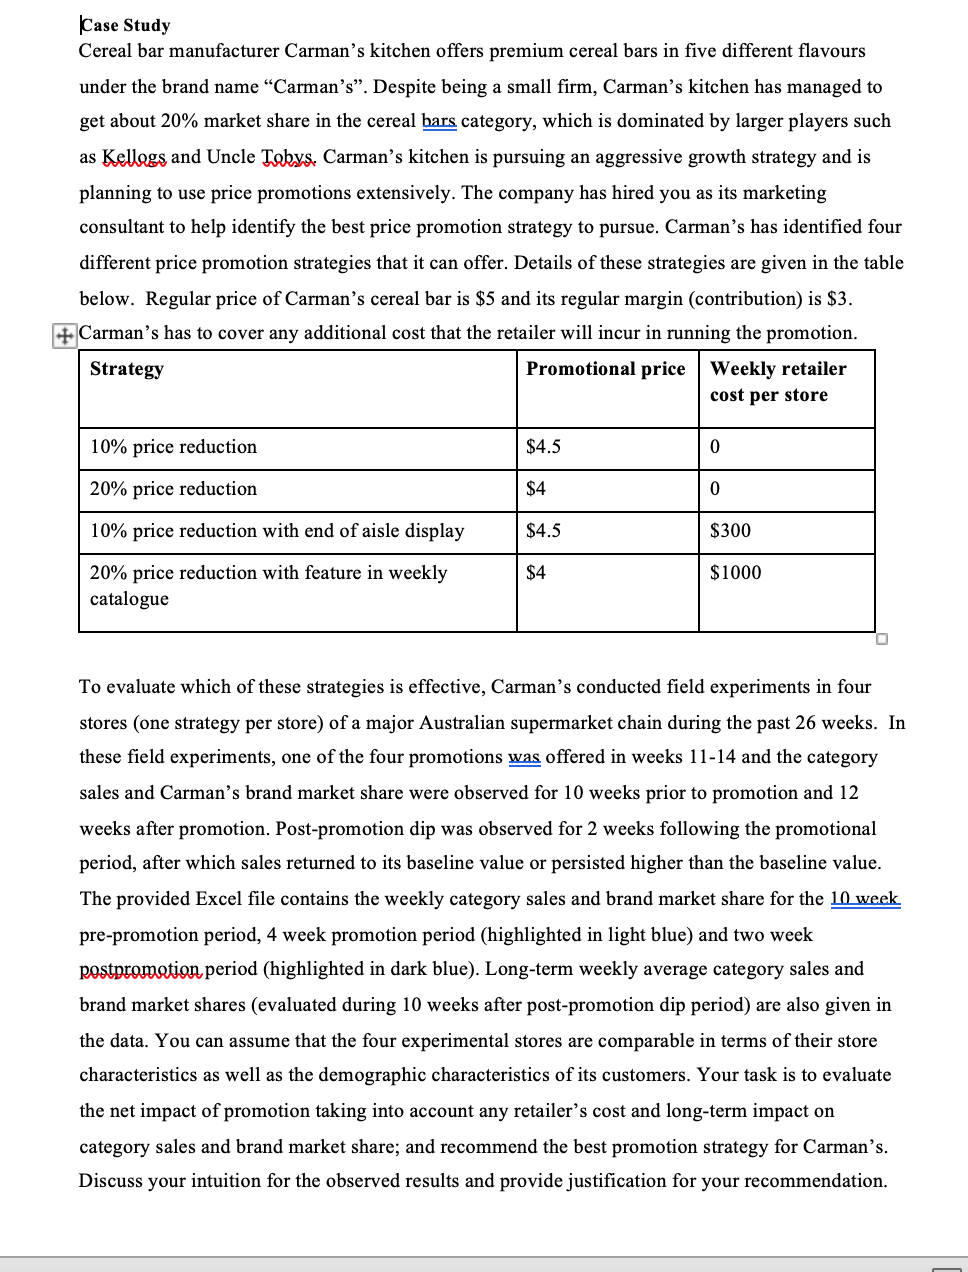
Ease Study Cereal bar manufacturer Carman's kitchen offers premium cereal bars in ve different avours under the brand name \"Carman's\". Despite being a small rm, Carman's kitchen has managed to get about 20% market share in the cereal E category, which is dominated by larger players such as Kellogg and Uncle Inlays. Carman's kitchen is pursuing an aggressive growth strategy and is planning to use price promotions extensively. The company has hired you as its marketing consultant to help identify the best price promotion strategy to pursue. Carman's has identied four different price promotion strategies that it can offer. Details of these strategies are given in the table below. Regular price of Carman's cereal bar is $5 and its regular margin (contribution) is $3. .Carman's has to cover any additional cost that the retailer will incur in running the promotion. Promotional price Weekly retailer cost per store 10% price reduction with end of aisle display $300 20% price reduction with feature' in weekly $1000 catalogue To evaluate which of these strategies is effective, Carman's conducted eld experiments in four stores (one strategy per store) of a major Australian supermarket chain during the past 26 weeks. In these eld experiments, one of the four promotions 11:41:; offered in weeks 11-14 and the category sales and Carman's brand market share were observed for 10 weeks prior to promotion and 12 weeks after promotion. Post-promotion dip was observed for 2 weeks following the promotional period, after which sales returned to its baseline value or persisted higher than the baseline value. The provided Excel le contains the weekly category sales and brand market share for the L0_week. pre-promotion period, 4 week promotion period (highlighted in light blue) and two week Wpeod (highlighted in dark blue). Long-term weekly average category sales and brand market shares (evaluated during 10 weeks after post-promotion dip period) are also given in the data. You can assume that the four experimental stores are comparable in terms of their store characteristics as well as the demographic characteristics of its customers. Your task is to evaluate the net impact of promotion taking into account any retailer's cost and long-term impact on category sales and brand market share; and recommend the best promotion strategy for Carman's. Discuss your intuition for the observed results and provide justication for your recommendation. Submission The assignment consists of two parts: Analysis and Report. You are required to submit both your written report (approx. 2000 words} and analysis les (conducted in MS-Excel). ' Analysis Students are expected to complete the analysis task in MS-Excel. The analysis file is expected to be a part of your submission. Before submitting your analysis make sure it is logically organised and any incorrect or unnecessary output has been removed. In your Excel le all calculated gures are expected to be tied to appropriate Excel functions. Note: Give your analysis les an appropriate name such as MI5384_A2_Group number.xlsx. ' Report The report should be written based on your analysis output. As a general guide, you are expected to start your report with a brief introduction and after explaining your methodology and interpreting your analysis ndings, conclude the report by a recommendations section. Note: Name the report with an appropriate le name such as Ml5384_A2_Group number.docx. A C E G M B D H K N Strategy 1 Strategy 2 Strategy 3 Strategy 4 Week Category sales Brand market share Brand sales Category sales Brand market sha Brand sales Category sales Brand market sha Brand sales Category sales Brand market s Brand sales 9.18% 1099 9.77% 969 10180 9.52% 969 9.64% 929 11970 OVAUIAWN 11120 8.81% 980 12030 10.55% 1269 7790 10.01% 780 12120 10.31% 1250 13910 9.70% 1349 11280 10.10% 1139 10430 9.97% 1040 1204 10.21% 1229 9.57% 790 15630 10.10% 1579 9.24% 560 12020 1329 8160 10.04% 819 10080 10.31% 1039 11670 9.42% 1099 12200 10. 16% 1240 1219 9340 11.45% 1069 9.12% 730 13030 9.20% 1199 11860 10.28% 1080 9290 10.97% 1019 1032 10.65% 1099 13480 9.79% 1320 12090 8.93% 8 10120 10.96% 1109 0770 9.00% 969 11210 10.70% 1199 1750 9.10% 1069 1260 9000 9.00% 810 9.93% 949 11930 11.06% 1319 11910 9.90% 10 990 10.82% 1179 10460 9.46% 10.67% 16530 1789 14870 15.87% 2360 11 10770 11.79% 1270 14170 14.96% 2120 13570 13.78% 1870 11150 13.81% 11390 14.39% 13290 12.64% 1680 15030 15.83% 2379 12 13 12.40% 849 14230 15.53% 2210 14060 12.44% 1749 14750 16.40% 2419 12.06% 1189 11150 15.06% 1679 12920 12.30% 1589 14950 15.78% 2359 14 9860 15 11530 7.54% 869 10540 9.01% 950 12040 8.96% 1079 13080 7.49% 980 17 18 16 3360 11.60% 970 11270 9.67% 1090 13900 8.70% 1209 13780 8.49% 1170 19 20 21 (Avg. weekly values) Strategy 1 Strategy 2 Strategy 3 Strategy 4 22 Baseline category sales 9957 11996 23 Baseline brand sales 990 24 Promotion sales 1212 1722 25 Post - promotion sales 920 26 Incremental sales 222 800 499 1184 27 Post - promotion dip 71 121 28 Regular margin 3.00 $ 3.00 $ 3.00 $ 3.00 29 Promotion margin 2.50 $ 2.00 $ 2.50 $ 2.00 30 Incremental gain 2,216.16 $ 6,398.02 $ 9,471.40 31 Foregone contribution 1,980.83 $ 4,448.95 2,446.80 $ 4,781.53 32 Post promotion loss 476.40 $ 723.45 33 Retailer (fixed) costs 1,200.00 $ 4,000.00 34 Net effect of promotion 235.33 $ 1,949.07 $ 1,339.20 $ 689.87 35 36 Long term effects 37 Avg. weekly category sales 9764 10999 12973 38 Avg. weekly brand sales 994 1299 39 % Gain in category sales -1.94% 0.71% 5.82% 8.68% 40 Long term gain in brand sales 76 359 41 Long term gain in brand profit $10.76 $623.29 $226.80 $1,075.85 42 43 Sheet1 +


