Hi, please help me, I really need your help in this question, I really do not know where to start for this question, what kind of accounts would be affected and what are the reasons.
Illustrate Covid-19's impact on telecommunication company's financial reporting by selecting any five (5) accounts from its statements of financial position or consolidated income statement that you estimate to be seriously affected by Covid-19, with detailed explanation.
Would really really appreciate if someone can actually help me in this question..
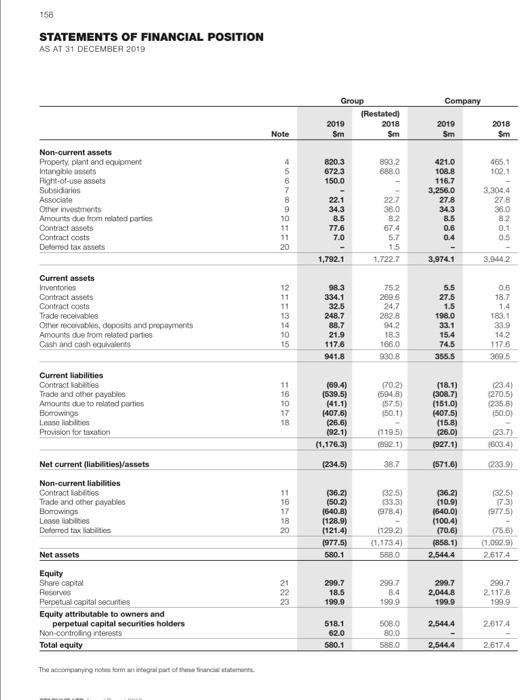
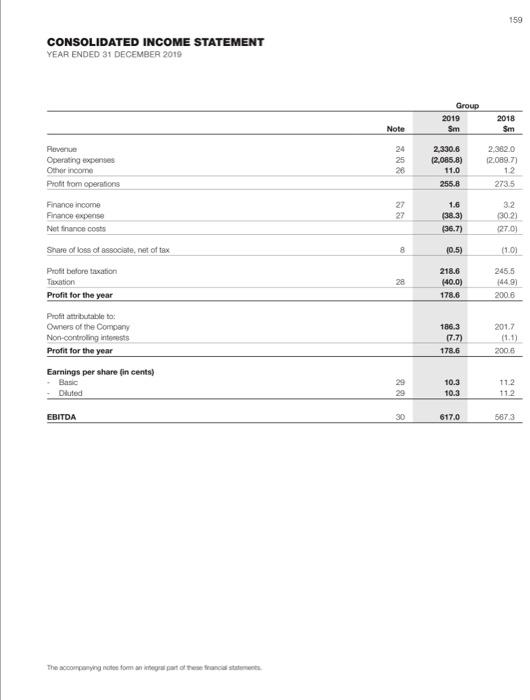
The attachments are the statement of financial position and the consolidated income statement.
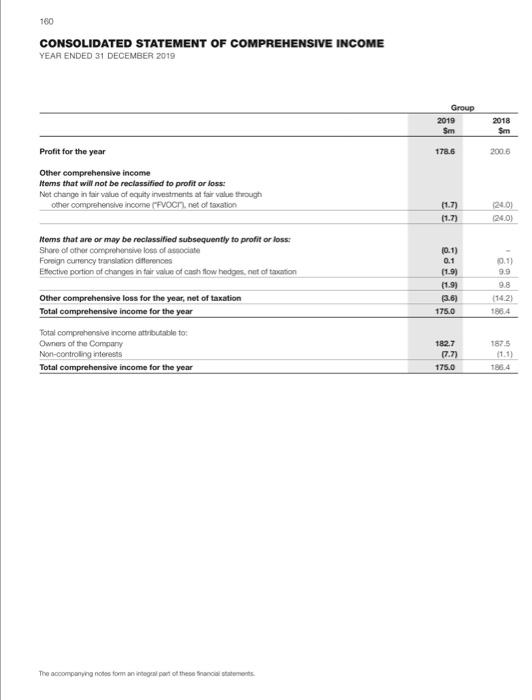
158 STATEMENTS OF FINANCIAL POSITION AS AT 31 DECEMBER 2010 Company Group (Restated) 2010 2018 Sm Sm 2010 Sm 2018 Sim Note 820.3 6723 150.0 893.2 8880 421.0 108.6 465.1 102.1 116.7 Non-current assets Property, plant and equipment Intangible assets Right-of-use assets Subsidiaries Associate Other investments Amounts due from related parties Contract assets Contract costs Deferred taxes 4 5 6 7 8 9 10 11 11 20 22.1 34.3 8.5 77.6 7.0 22.7 380 8.2 67.4 5.7 1.5 1.722.7 3.256.0 27.8 34.3 8.5 0.6 0.4 3,304,4 278 38.0 8.2 0.1 0.5 1,792.1 3,974.1 3.9-642 Current assets Inventories Contract assets Contract costs Trade receivables Other rouvables, deposits and prepayments Amounts due from related parties Cash and cash equivalents 12 11 11 13 98.3 334.1 32.5 248.7 88.7 21.9 117.6 941.8 752 288.5 24,7 2828 942 18.3 1660 930.B 5.5 27.5 1.5 198.0 33.1 15.4 74.5 355.5 0.5 18.7 1.4 183.1 33.9 14,2 117.6 309.5 10 15 Current liabilities Contract abilities Trade and other payables Amounts due to related parties Borrowings Lease lebties Provision for taxation 11 16 10 17 18 (69.4) (539.5) (41.1) (407.6) (26.6) (92.1) (1.170.3) (702) (594) (575) 150.1) (18.1) (308.7) (151.0) (407.5) (15.8) (26.0) 1927.1) (23.4) 270.5) 1235.6) 150.0) (23.71 (119.5) (892.1) (234.5) 38.7 (571.6) (233.9) Net current (labilities/assets Non-current liabilities Contract labities Trade and other payables Borowings Lease liblities Deferred tax liabilities 11 16 17 18 20 132.5) 133.3) 978.4) 132.5) 73) 1977.5) (36.2) (50.2) 1640.8) (1289) (121.4) (977.5) 580.1 (36.21 (10.9) (640.0) (100.4) (70.6) (858.1) 2,544.4 (129.23 (1.173.4) 5880 75.5) (1.092.9) 2.617.4 Net assets 21 22 23 299.7 18.5 199.9 299,7 8.4 1999 299.7 2,044,8 199.9 299.7 2.117.8 199.9 Equity Share capital Reserves Perpetual capital Securities Equity attributable to owners and perpetual capital securities holders Non-controlling interests Total equity 2,5444 2.6174 518.1 62.0 580.1 508.0 800 5880 2,5444 2.617.4 The company nou man integral part of the Stars 159 CONSOLIDATED INCOME STATEMENT YEAR ENDED 31 DECEMBER 2019 Group 2019 Sm 2018 Sm Note 24 25 28 2,330.6 12,085.8) 11.0 255.8 Fevenue Operating expenses Other income Profit from operations Finance Income Finance expense Net ot finance costs 2.382.0 12.089.77 12 2735 27 27 1.6 (38.3) (36.7) 32 30 21 127.01 8 (0.5) 11:01 28 218.6 (40.0) 178.6 245.5 144.99 2006 Share of loss of associate, net of tax Profit before taxation Taxation Profit for the year Profit attributable to: Owners of the Company Non-controlling interests Profit for the year 2017 186.3 17.7) 178.6 2008 Earnings per share in cents) - Basic Dluted 29 29 10.3 10.3 112 112 EBITDA 30 617.0 5673 The coming tomatoes Francis 160 CONSOLIDATED STATEMENT OF COMPREHENSIVE INCOME YEAR ENDED 31 DECEMBER 2019 Group 2019 Sm 2018 Sim 178.6 2006 Profit for the year Other comprehensive income Items that will not be reclassified to profit or loss: Not change in fair value of equity investments affair value through Other comprehensive income rivochnet of socation (1.7) 11.7) 24.01 24.03 Items that are or may be reclassified subsequently to profit or loss Share of other comprehensive loss of associate Foreign currency translation differences Etfective portion of changes in fair value of cash flow hedges not of action (0.1) 0.1 (1.9) (1.9) 0.1) 9.9 9.8 (14.21 188.4 Other comprehensive loss for the year, net of taxation Total comprehensive income for the year 175.0 Total comprehensive income attributable to Owners of the Company Non-controlling interests Total comprehensive income for the year 182.7 (7.7) 175.0 187.5 (1.1) 1884 The companying notes from an integer port of these terms 158 STATEMENTS OF FINANCIAL POSITION AS AT 31 DECEMBER 2010 Company Group (Restated) 2010 2018 Sm Sm 2010 Sm 2018 Sim Note 820.3 6723 150.0 893.2 8880 421.0 108.6 465.1 102.1 116.7 Non-current assets Property, plant and equipment Intangible assets Right-of-use assets Subsidiaries Associate Other investments Amounts due from related parties Contract assets Contract costs Deferred taxes 4 5 6 7 8 9 10 11 11 20 22.1 34.3 8.5 77.6 7.0 22.7 380 8.2 67.4 5.7 1.5 1.722.7 3.256.0 27.8 34.3 8.5 0.6 0.4 3,304,4 278 38.0 8.2 0.1 0.5 1,792.1 3,974.1 3.9-642 Current assets Inventories Contract assets Contract costs Trade receivables Other rouvables, deposits and prepayments Amounts due from related parties Cash and cash equivalents 12 11 11 13 98.3 334.1 32.5 248.7 88.7 21.9 117.6 941.8 752 288.5 24,7 2828 942 18.3 1660 930.B 5.5 27.5 1.5 198.0 33.1 15.4 74.5 355.5 0.5 18.7 1.4 183.1 33.9 14,2 117.6 309.5 10 15 Current liabilities Contract abilities Trade and other payables Amounts due to related parties Borrowings Lease lebties Provision for taxation 11 16 10 17 18 (69.4) (539.5) (41.1) (407.6) (26.6) (92.1) (1.170.3) (702) (594) (575) 150.1) (18.1) (308.7) (151.0) (407.5) (15.8) (26.0) 1927.1) (23.4) 270.5) 1235.6) 150.0) (23.71 (119.5) (892.1) (234.5) 38.7 (571.6) (233.9) Net current (labilities/assets Non-current liabilities Contract labities Trade and other payables Borowings Lease liblities Deferred tax liabilities 11 16 17 18 20 132.5) 133.3) 978.4) 132.5) 73) 1977.5) (36.2) (50.2) 1640.8) (1289) (121.4) (977.5) 580.1 (36.21 (10.9) (640.0) (100.4) (70.6) (858.1) 2,544.4 (129.23 (1.173.4) 5880 75.5) (1.092.9) 2.617.4 Net assets 21 22 23 299.7 18.5 199.9 299,7 8.4 1999 299.7 2,044,8 199.9 299.7 2.117.8 199.9 Equity Share capital Reserves Perpetual capital Securities Equity attributable to owners and perpetual capital securities holders Non-controlling interests Total equity 2,5444 2.6174 518.1 62.0 580.1 508.0 800 5880 2,5444 2.617.4 The company nou man integral part of the Stars 159 CONSOLIDATED INCOME STATEMENT YEAR ENDED 31 DECEMBER 2019 Group 2019 Sm 2018 Sm Note 24 25 28 2,330.6 12,085.8) 11.0 255.8 Fevenue Operating expenses Other income Profit from operations Finance Income Finance expense Net ot finance costs 2.382.0 12.089.77 12 2735 27 27 1.6 (38.3) (36.7) 32 30 21 127.01 8 (0.5) 11:01 28 218.6 (40.0) 178.6 245.5 144.99 2006 Share of loss of associate, net of tax Profit before taxation Taxation Profit for the year Profit attributable to: Owners of the Company Non-controlling interests Profit for the year 2017 186.3 17.7) 178.6 2008 Earnings per share in cents) - Basic Dluted 29 29 10.3 10.3 112 112 EBITDA 30 617.0 5673 The coming tomatoes Francis 160 CONSOLIDATED STATEMENT OF COMPREHENSIVE INCOME YEAR ENDED 31 DECEMBER 2019 Group 2019 Sm 2018 Sim 178.6 2006 Profit for the year Other comprehensive income Items that will not be reclassified to profit or loss: Not change in fair value of equity investments affair value through Other comprehensive income rivochnet of socation (1.7) 11.7) 24.01 24.03 Items that are or may be reclassified subsequently to profit or loss Share of other comprehensive loss of associate Foreign currency translation differences Etfective portion of changes in fair value of cash flow hedges not of action (0.1) 0.1 (1.9) (1.9) 0.1) 9.9 9.8 (14.21 188.4 Other comprehensive loss for the year, net of taxation Total comprehensive income for the year 175.0 Total comprehensive income attributable to Owners of the Company Non-controlling interests Total comprehensive income for the year 182.7 (7.7) 175.0 187.5 (1.1) 1884 The companying notes from an integer port of these terms


