

Question
Hi! Please help me with this. Show the full solution since the handouts given by my professor is incomplete :( I want to know the
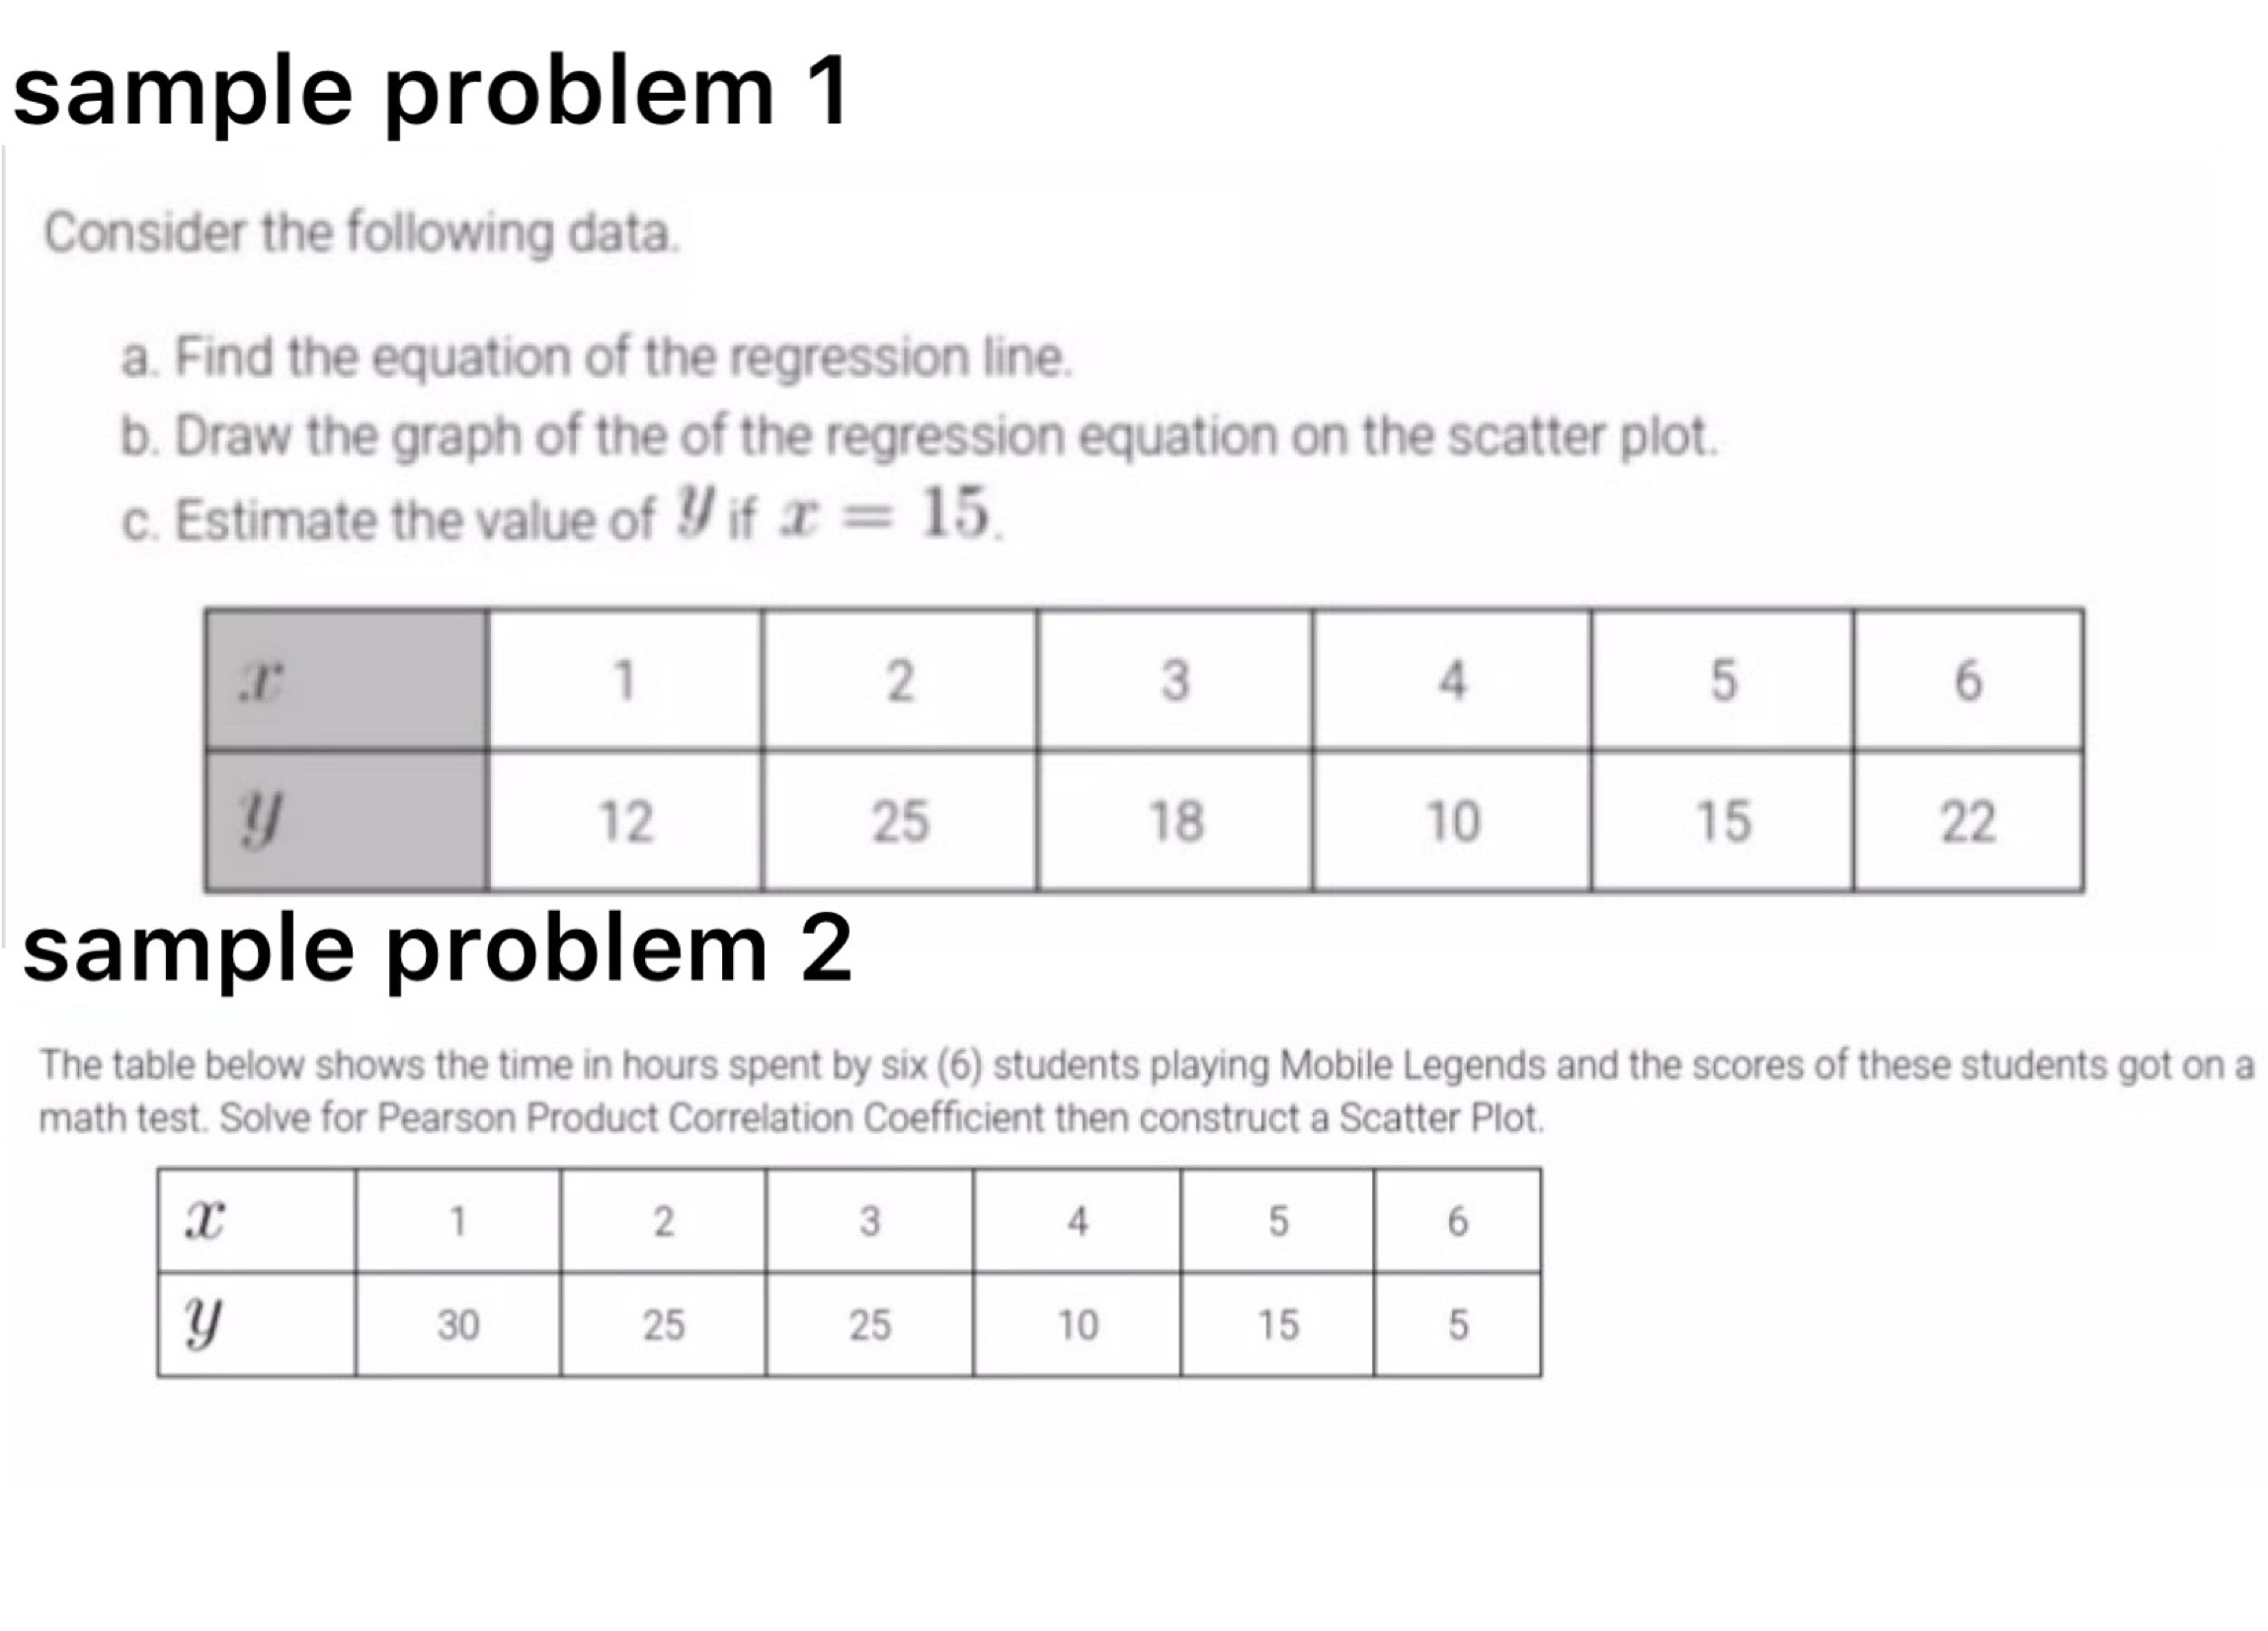
Hi! Please help me with this. Show the full solution since the handouts given by my professor is incomplete :( I want to know the formulas and how to do the scatter plot. Please show manual solution not through excel but excel may be used for the scatter plot thank you :(
Step by Step Solution
There are 3 Steps involved in it
Step: 1

Get Instant Access to Expert-Tailored Solutions
See step-by-step solutions with expert insights and AI powered tools for academic success
Step: 2

Step: 3
Ace Your Homework with AI
Get the answers you need in no time with our AI-driven, step-by-step assistance
Get Started
Measure Theory And Integration
Authors: M M Rao, MM Rao
2nd Edition
1351991485, 9781351991483