 hi, please I need the full answer for this question and make sure to show all steps to make it easy for me to understand it. thank you
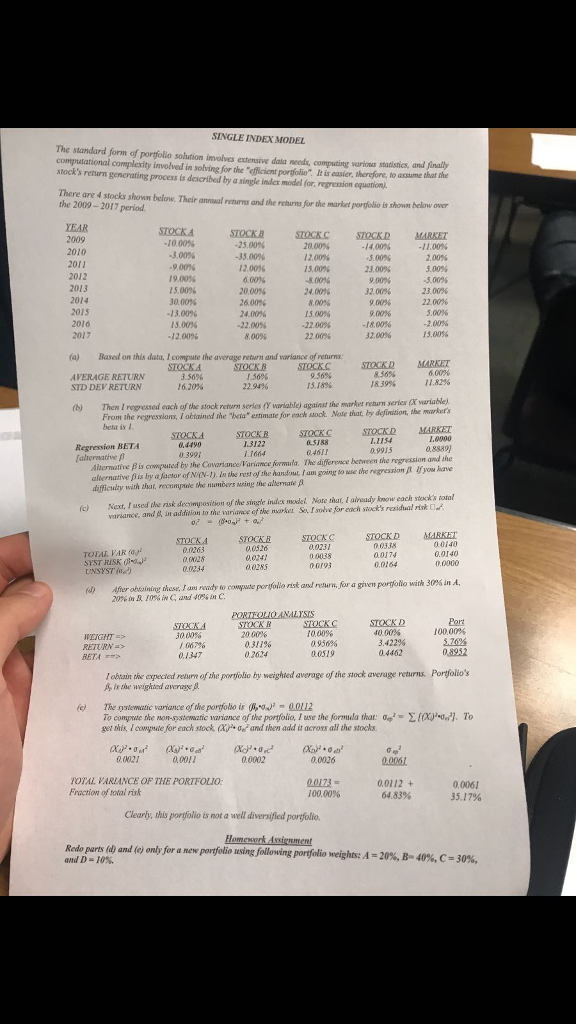
SINGLE INDEX MODEL The standard form of portfolio solution involves extensive daia needs, computing varionus statisnics, and finaly compulational complexity involved in solving for the "efficient portfolio It izs easier, therefore, to assume that the stock's return generaring process is described by a single index model (or, regression equation) There are 4 stocks shown below. Their anual retures and the returns for the market porgfolio is showat below over the 2009-2017 period YEAR 2009 STOCKC STOCKD MARKET 1000% -25.00% -35.00% 12.00% 20.00% ,14,00% 23.00% 32.00% 2.00% 9 00% 15.00% -800% 24 00% 8.00% 2012 15.00% 30 00% 13.00% 15.00% -12.00% 26,00% 24.00% -22.00% 8.00% -5.00% 23.00% 22.00% 5.00% 2016 -22.00% 22 00% -18.00% 32.00% (a) Based on this data, I compute the average return and variance of returns: SLOCKD MARKET 8.56% AVERAGE RETURN STD DEV RETURAN 22.94% 15.18% (b) Then I regesod cach of the stock raturn series (Yvariabley agsinst the market reasurm serk From the regressions,Iotained the heta estimate for each stock Note that, by definition, the markers bela is l. STOCK STOCKR MARKE 188 0.461 0.4490 Regression BETA alternative p 09915 uta. I he diference between iempession and he ? is computed by iheCowariancolanancefor rest of the handout, fam govinge do use the regression t If you have c) Next, useod the risk deconresition of the stinle index mxdel. Nore shat, I already now each stosk's tota STOCKD T alternative pis by a Jactor of NN-) In the difficubty with that, recompale the nnbers meing the alhernate A varkance, and in aidilion to the maniance of the markst S I sobe for ench stock's residiual isk 0.0263 TOTAL VAR SYST RISK 0.0285 0,0164 0.0234 After obtaining these. I asinady so co syste portfolio n k and nturn, 20% in B,10% in C. and 40% in C. or a gren port olio with 30% in A. YSTs Port 100.00% STOCKD 10.00% 0.950% 00519 2001% 30.00% / 067% 0.1347 0.311% 3.422% RETURNE> 0,8952 I obtain the expecied return of the porgolio by weighted average of the stock average returus Portjolio's A, is the weighted average B oJam 0.0112 The systematic variance ofthe portfolio is To compude the non-ystewatic variance of the portfolio, I use the formuela that: ]. To (e) get skis, l congste for each stock (X), ?. and then add it across all the socks. 0.0026 O?AL VARI Fractiow of total risk NCE OF THE PORTFOLIO 0.0112 + 64,83% 0.0061 35.17% 100.00% Clearly, this portfolio is not a wel diversified porfolio. Redo parts (d) and (e) only for a new portfolio ming following portfolio weights: A-20%, B-40%, C-30%, SINGLE INDEX MODEL The standard form of portfolio solution involves extensive daia needs, computing varionus statisnics, and finaly compulational complexity involved in solving for the "efficient portfolio It izs easier, therefore, to assume that the stock's return generaring process is described by a single index model (or, regression equation) There are 4 stocks shown below. Their anual retures and the returns for the market porgfolio is showat below over the 2009-2017 period YEAR 2009 STOCKC STOCKD MARKET 1000% -25.00% -35.00% 12.00% 20.00% ,14,00% 23.00% 32.00% 2.00% 9 00% 15.00% -800% 24 00% 8.00% 2012 15.00% 30 00% 13.00% 15.00% -12.00% 26,00% 24.00% -22.00% 8.00% -5.00% 23.00% 22.00% 5.00% 2016 -22.00% 22 00% -18.00% 32.00% (a) Based on this data, I compute the average return and variance of returns: SLOCKD MARKET 8.56% AVERAGE RETURN STD DEV RETURAN 22.94% 15.18% (b) Then I regesod cach of the stock raturn series (Yvariabley agsinst the market reasurm serk From the regressions,Iotained the heta estimate for each stock Note that, by definition, the markers bela is l. STOCK STOCKR MARKE 188 0.461 0.4490 Regression BETA alternative p 09915 uta. I he diference between iempession and he ? is computed by iheCowariancolanancefor rest of the handout, fam govinge do use the regression t If you have c) Next, useod the risk deconresition of the stinle index mxdel. Nore shat, I already now each stosk's tota STOCKD T alternative pis by a Jactor of NN-) In the difficubty with that, recompale the nnbers meing the alhernate A varkance, and in aidilion to the maniance of the markst S I sobe for ench stock's residiual isk 0.0263 TOTAL VAR SYST RISK 0.0285 0,0164 0.0234 After obtaining these. I asinady so co syste portfolio n k and nturn, 20% in B,10% in C. and 40% in C. or a gren port olio with 30% in A. YSTs Port 100.00% STOCKD 10.00% 0.950% 00519 2001% 30.00% / 067% 0.1347 0.311% 3.422% RETURNE> 0,8952 I obtain the expecied return of the porgolio by weighted average of the stock average returus Portjolio's A, is the weighted average B oJam 0.0112 The systematic variance ofthe portfolio is To compude the non-ystewatic variance of the portfolio, I use the formuela that: ]. To (e) get skis, l congste for each stock (X), ?. and then add it across all the socks. 0.0026 O?AL VARI Fractiow of total risk NCE OF THE PORTFOLIO 0.0112 + 64,83% 0.0061 35.17% 100.00% Clearly, this portfolio is not a wel diversified porfolio. Redo parts (d) and (e) only for a new portfolio ming following portfolio weights: A-20%, B-40%, C-30%