
Hi there, explain all the parts and the necessary formulas, theories, and present clear diagrams, prefer typing, expecially make a strong emphasis on the part a) on where and what formulas it is used to calculate the marginal revenue, net marginal revenue and net revenue, what are all those means, what formulas used, how did they work it out, step by step, thanks
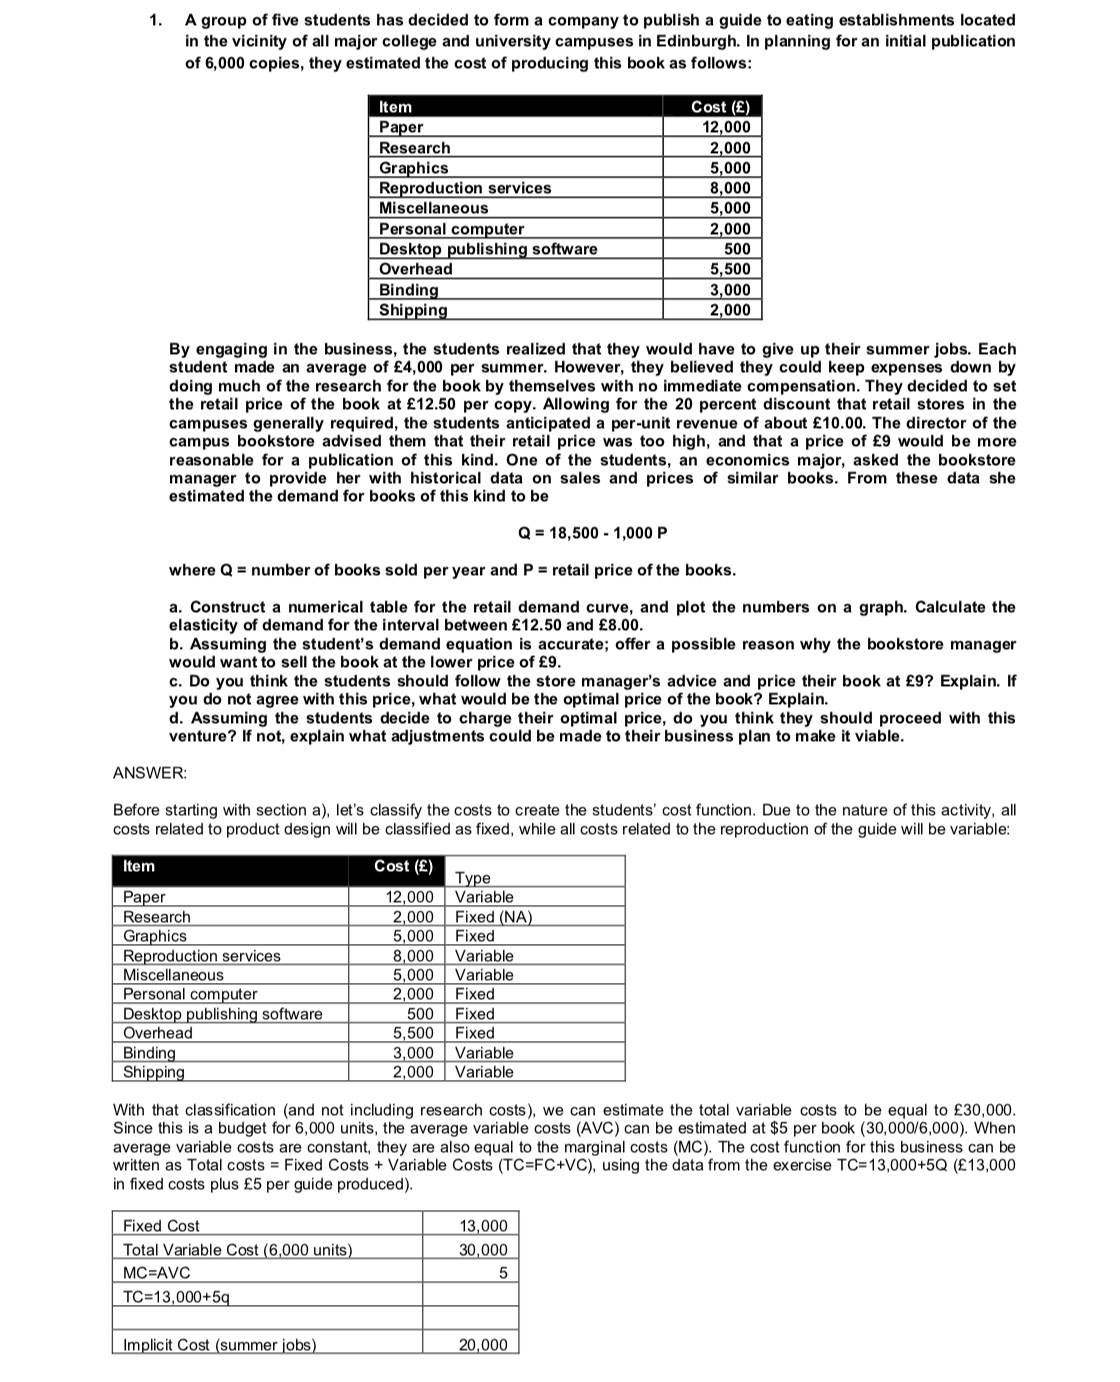
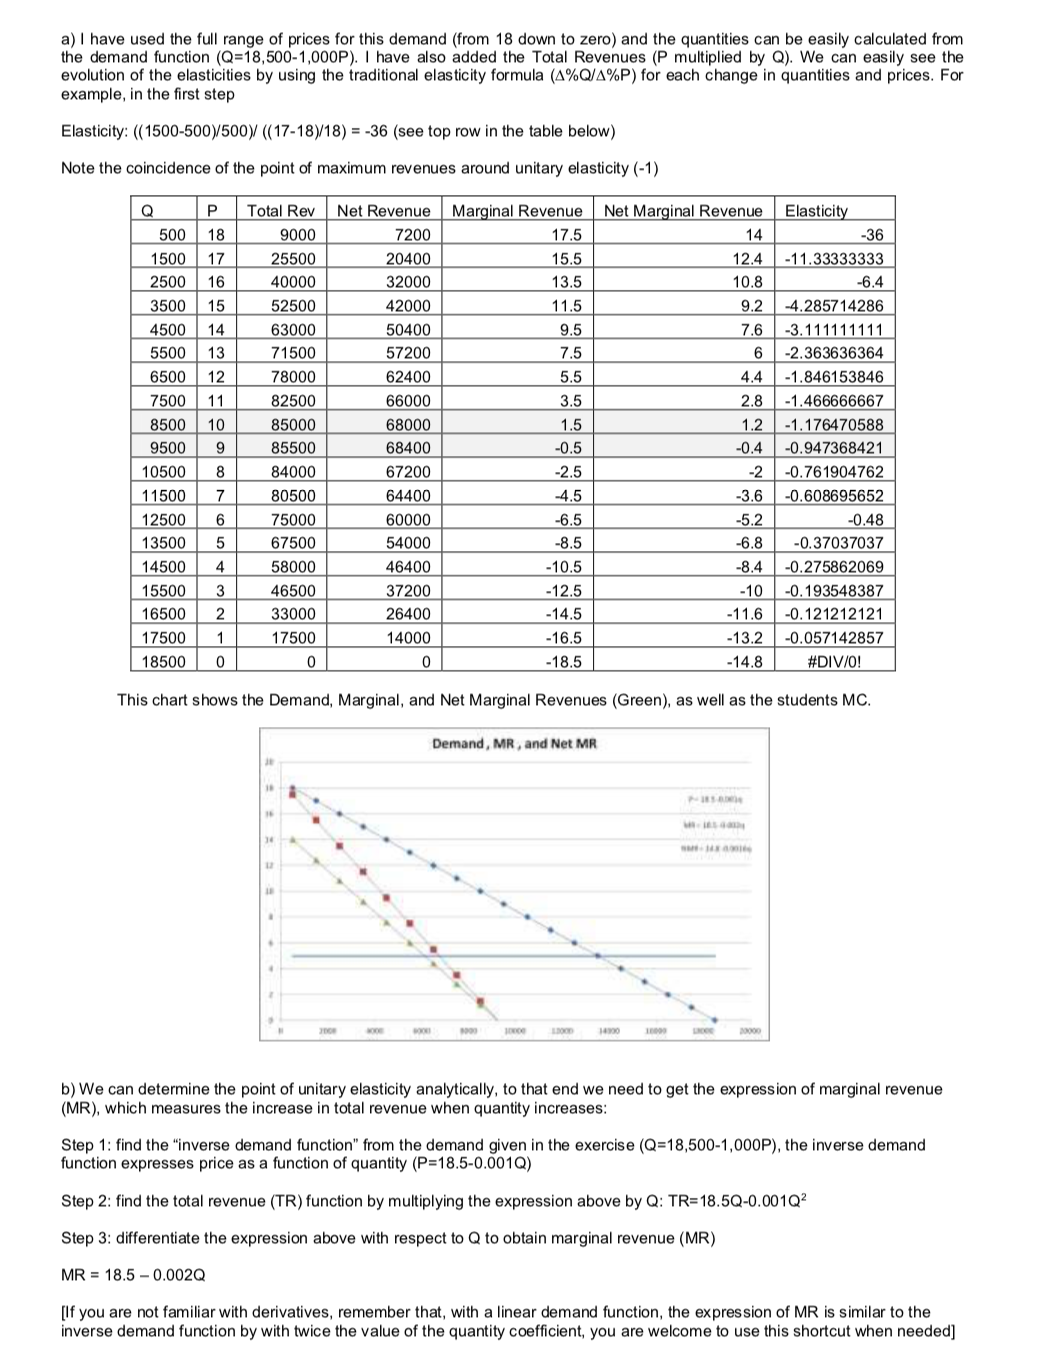
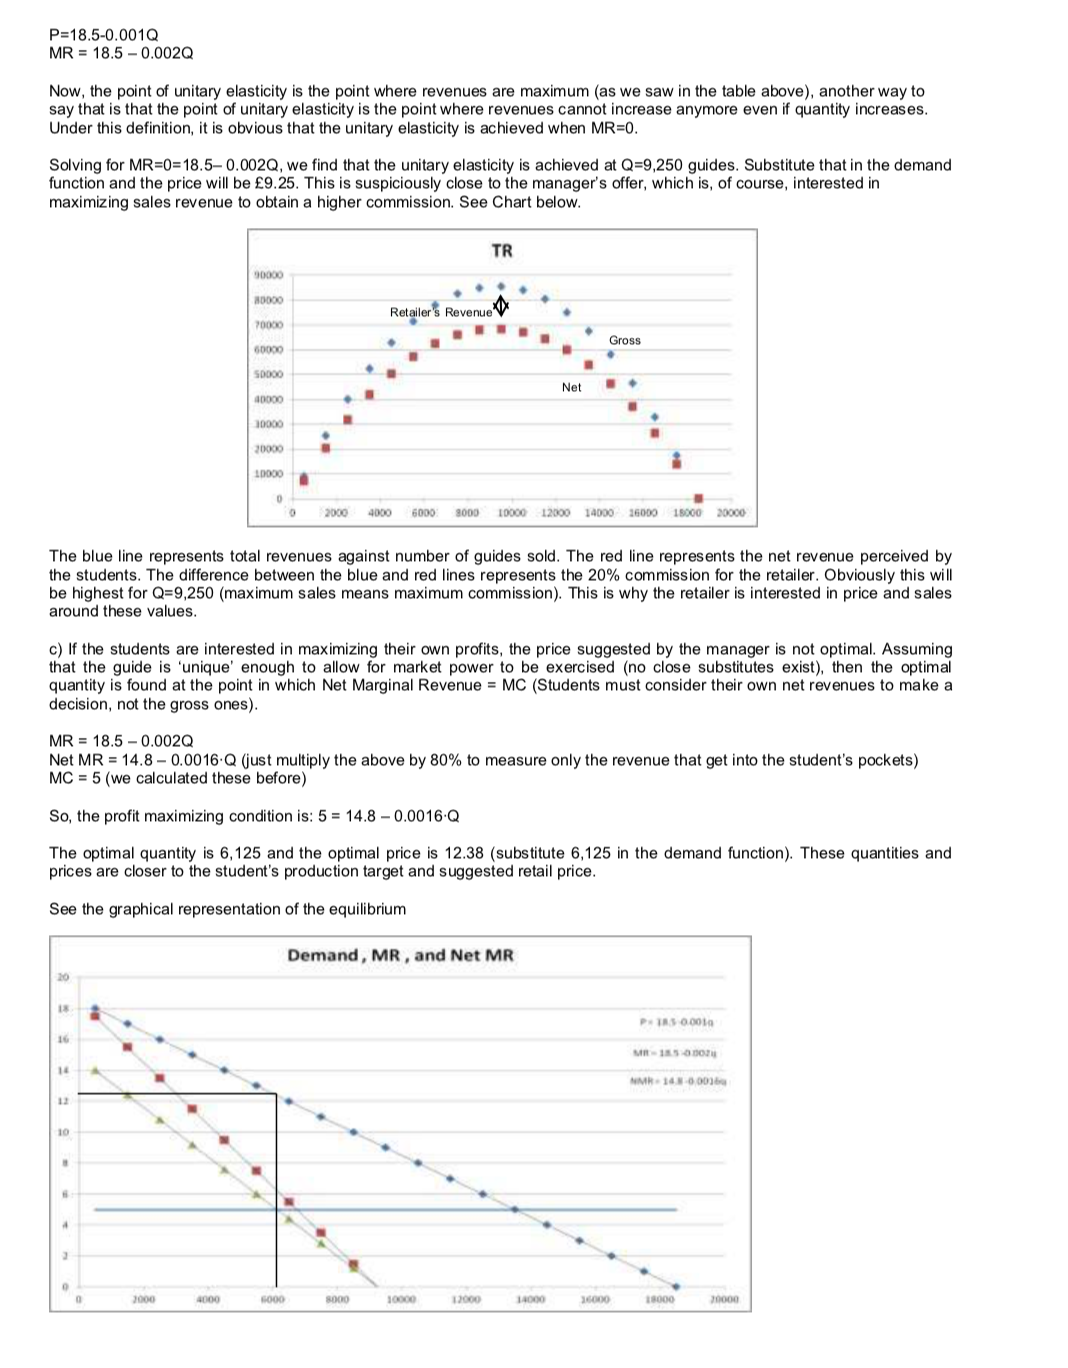
1. A group of five students has decided to form a company to publish a guide to eating establishments located in the vicinity of all major college and university campuses in Edinburgh. In planning for an initial publication of 6,000 copies, they estimated the cost of producing this book as follows: Item Cost (E) Paper 2,000 Research ,000 Graphics 5,000 Reproduction services 8,000 Miscellaneous 5,000 Personal computer 2,000 Desktop publishing software 500 Overhead 5,500 Binding 3,000 Shipping 2,000 By engaging in the business, the students realized that they would have to give up their summer jobs. Each student made an average of $4,000 per summer. However, they believed they could keep expenses down by doing much of the research for the book by themselves with no immediate compensation. They decided to set the retail price of the book at $12.50 per copy. Allowing for the 20 percent discount that retail stores in the campuses generally required, the students anticipated a per-unit revenue of about $10.00. The director of the campus bookstore advised them that their retail price was too high, and that a price of $9 would be more reasonable for a publication of this kind. One of the students, an economics major, asked the bookstore manager to provide her with historical data on sales and prices of similar books. From these data she estimated the demand for books of this kind to be Q = 18,500 - 1,000 P where Q = number of books sold per year and P = retail price of the books. a. Construct a numerical table for the retail demand curve, and plot the numbers on a graph. Calculate the elasticity of demand for the interval between $12.50 and $8.00. b. Assuming the student's demand equation is accurate; offer a possible reason why the bookstore manager would want to sell the book at the lower price of $9 c. Do you think the students should follow the store manager's advice and price their book at $9? Explain. If you do not agree with this price, what would be the optimal price of the book? Explain. d. Assuming the students decide to charge their optimal price, do you think they should proceed with this venture? If not, explain what adjustments could be made to their business plan to make it viable. ANSWER: Before starting with section a), let's classify the costs to create the students' cost function. Due to the nature of this activity, all costs related to product design will be classified as fixed, while all costs related to the reproduction of the guide will be variable: Item Cost (E) Type Paper 12,000 Variable Research 2,000 Fixed (NA) Graphics 5,000 Fixed Reproduction services 8,000 Variable Miscellaneous 5,000 Variable Personal computer 2,000 Fixed Desktop publishing software 500 Fixed Overhead 5,500 Fixed Binding 3,000 Variable Shipping 2,000 Variable With that classification (and not including research costs), we can estimate the total variable costs to be equal to $30,000. Since this is a budget for 6,000 units, the average variable costs (AVC) can be estimated at $5 per book (30,000/6,000). When average variable costs are constant, they are also equal to the marginal costs (MC). The cost function for this business can be written as Total costs = Fixed Costs + Variable Costs (TC=FC+VC), using the data from the exercise TC=13,000+5Q ($13,000 in fixed costs plus $5 per guide produced). Fixed Cost 13,000 Total Variable Cost (6,000 units) 30,000 MC=AVC TC=13,000+5q Implicit Cost (summer jobs) 20,000a) I have used the full range of prices for this demand (from 18 down to zero) and the quantities can be easily calculated from the demand function (Q=18,500-1,000P). I have also added the Total Revenues (P multiplied by Q). We can easily see the evolution of the elasticities by using the traditional elasticity formula (4%Q/A%P) for each change in quantities and prices. For example, in the first step Elasticity: ((1500-500)/500)/ ((17-18)/18) = -36 (see top row in the table below) Note the coincidence of the point of maximum revenues around unitary elasticity (-1) Q P Total Rev Net Revenue Marginal Revenue Net Marginal Revenue Elasticity 500 18 9000 7200 17.5 14 -36 1500 17 25500 20400 15.5 12.4 -11.33333333 2500 16 40000 32000 13.5 10.8 6.4 3500 15 52500 42000 11.5 9.2 -4.285714286 4500 14 63000 50400 9.5 7.6 -3. 111111111 5500 13 71500 57200 7.5 6 -2.363636364 6500 12 78000 62400 5.5 4.4 -1.846153846 7500 11 32500 66000 3.5 2.8 -1.466666667 8500 10 85000 68000 1.5 1.2 -1. 176470588 9500 9 35500 68400 -0.5 0.4 -0.947368421 10500 8 84000 67200 2.5 -2 -0.761904762 11500 80500 64400 4.5 -3.6 -0.608695652 12500 6 75000 60000 6.5 .5.2 -0.48 13500 67500 54000 -8.5 -6.8 -0.37037037 14500 58000 46400 -10.5 -8.4 -0.275862069 15500 3 46500 37200 -12.5 -10 -0. 193548387 16500 2 33000 26400 -14.5 11.6 -0. 121212121 17500 17500 14000 16.5 13.2 -0.057142857 18500 0 0 0 18.5 -14.8 #DIV/O! This chart shows the Demand, Marginal, and Net Marginal Revenues (Green), as well as the students MC. Demand, MR , and Net MR 14300 15099 b) We can determine the point of unitary elasticity analytically, to that end we need to get the expression of marginal revenue (MR), which measures the increase in total revenue when quantity increases: Step 1: find the "inverse demand function" from the demand given in the exercise (Q=18,500-1,000P), the inverse demand function expresses price as a function of quantity (P=18.5-0.001Q) Step 2: find the total revenue (TR) function by multiplying the expression above by Q: TR=18.5Q-0.001Q2 Step 3: differentiate the expression above with respect to Q to obtain marginal revenue (MR) MR = 18.5 - 0.002Q [If you are not familiar with derivatives, remember that, with a linear demand function, the expression of MR is similar to the inverse demand function by with twice the value of the quantity coefficient, you are welcome to use this shortcut when needed]P=13.5-0.001Q MR = 13.5 0.0020 Now. the point of unitary elasticity is the point where revenues are maximum (as we saw In the table above). anotherway to saythat isthat the point of unitary elasticity is the point where revenues cannot increase anymore even if quantity increases. Under this definition. it is obvious that the unitary elasticity is achieved when MR=0. Solving for MR=0=13.5 0.0020. we find that the unitary elasticity is achieved at Q=9.250 guides. Substitute that in the demand function and the price will be 9.25. This is suspiciously close to the manager's offer. which is. of course. interested in maximizing sales revenue to obtain a higher commission. See Chart below. Til 0.. 0 Retiler' Revenue 0 lil o g .- I. .6113\" I Net '- .I O I I EM 3000 rm um) um I.\" man now The blue line represents total revenues against number of guides sold. The red line represents the net revenue perceived by the students. The difference between the blue and red lines represents the 20% commission for the retailer. Obviously this will be highest for 0:9.250 (maximum sales means maximum commission). This is why the retailer is interested in price and sales around these values. c) If the students are interested in maximizing their own profits. the price suggested by the manager is not optimal. Assuming that the guide is 'unique' enough to allow for market power to be exercised (no close substitutes exist). then the optimal quantity is found at the point in which Net Marginal Revenue = MC (Students must consider their own net revenues to make a decision. not the gross one s). MR = 13.5 0.0020 Net MR = 14.3 0.0015-0 (just multiplythe above by 30% to measure onlythe revenue that get intothe student's pockets) MC = 5 (we calculated these before) So. the profit maximizing condition is: 5 = 14.3 0.0015-0 The optimal quantity is 5.125 and the optimal price is 12.33 (substitute 5.125 in the demand function). These quantities and prices are closer to the student's production target and suggested retail price. See the graphical representation of the equilibrium Demand . MI! . and u MI! 10 ll _ ' . p. llI'lla III - o . ". III-1.11am! In A - b. I 0. null IOI smu- 11 am (In I000 com am | 2m 1w lull lm rm d) Determining the economic profit of this solution requires of an assumption on whether the fixed costs of setting this company and carrying out the research have already been sunk or not. If these costs (13,000) are already sunk (the company is already set up and the elaboration of the guide is underway), then the economic profit is positive and they should carry on. The exercise, however, is more interesting if we assume that they have not spent a dime yet. This is just a project on the student's minds, and they have not yet started their elaboration of the guide. Hence, at this point in time, the fixed costs are as avoidable as the other cost categories and the economic profit is indeed negative. Net Revenue 60,638 Variable Cost 30,625 Fixed Cost (if not sunk yet) 13,000 Implicit Cost (summer jobs) 20,000 Economic Profit 2,988 In order to make this investment worthy of their time they have several options: . Fire one of the students will reduce the implicit cost Use their own computers for the task Work from the computer labs in the uni to save overhead In addition, they can negotiate a lower discount with the bookshop manager. With their full MCs, they'd need to cut down the retailer's margin down to 16% to break even. The table below shows the recalculated equilibria for different margins: Retail Margin 20% 19% 18% 17% 16% 15% 6,125 6, 164 6,201 6,238 6,274 6,309 Retail Price 12.38 12.34 12.30 12.26 12.23 12.19 Net Revenue 60,638 61,590 62,539 63,487 64,432 65,375 Variable Cost 30,625 30,818 31,006 31,190 31,369 31,544 Fixed Cost (not sunk yet) 13,000 13,000 13,000 13,000 13,000 13,000 Implicit Cost 20,000 20,000 20,000 20,000 20,000 20,000 Economic Profit 2,988 2,228 1,467 703 63 831