Hi there, I am so stuck with this assignment. Due next Friday. Needs to be in Python. Thanks!
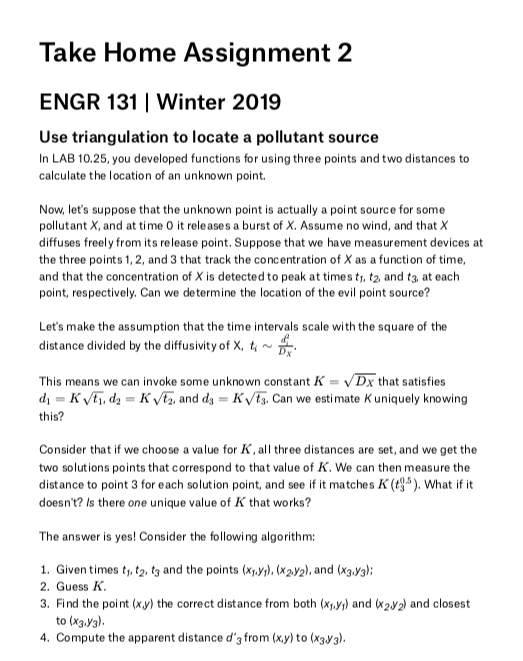
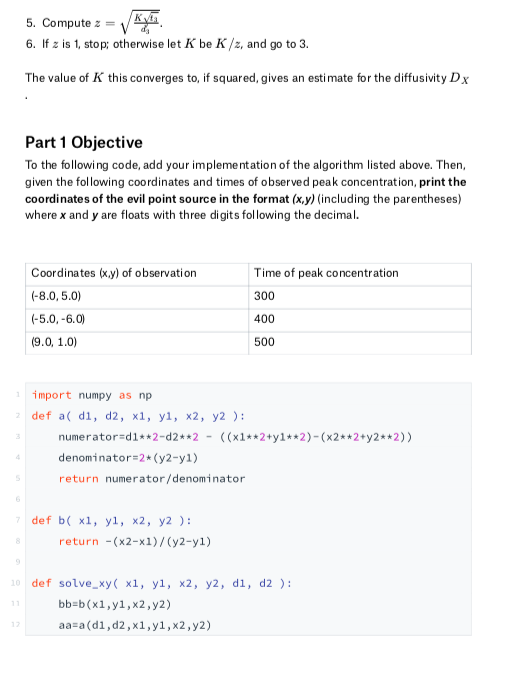
Take Home Assignment 2 ENGR 131 | Winter 2019 Use triangulation to locate a pollutant source In LAB 10.25, you developed functions for using three points and two distances to calculate the location of an unknown point. Now, let's suppose that the unknown point is actually a point source for some pollutant X, and at time 0 it releases a burst of X. Assume no wind, and that X diffuses freely from its release point. Suppose that we have measurement devices at the three points 1, 2, and 3 that track the concentration of X as a function of time, and that the concentration of X is detected to peak at times t, t2, and t3, at each point, respectively. Can we determine the location of the evil point source? Let's make the assumption that the time intervals scale with the square of the distance divided by the diffusivity of X, t This means we can invoke some unknown constant K-VDx that satisfies di-Kvti, d2- Kvt2, and ds-Kvts. Can we estimate Kuniquely knowing this? Consider that if we choose a value for K,all three distances are set, and we get the two solutions points that correspond to that value of K. We can then measure the distance to point 3 for each solution point, and see if it matches ( ht if it doesn't? Is there one unique value of K that works? The answer is yes! Consider the following algorithm: 1. Giventimes ty, t2, t3 and the points (x,.y), (xay2), and (x3.y3) 2. Guess K 3. Find the point (xy) the correct distance from both (x andV2) and closest to (x3.y3) 4. Compute the apparent distance d'3from (xy) to (x3V3) 5. Compute z 6. If z is 1, stop: otherwise let K be K/z, and go to 3. The value of K this converges to, if squared, gives an esti mate for the diffusivity Dx Part 1 Objective To the following code, add your implementation of the algorithm listed above. Then given the following coordinates and times of observed peak concentration, print the coordinates of the evil point source in the format (x,y)(including the parentheses) where x and y are floats with three digits following the decimal. Coordinates (x.y) of observation (-8.0,5.0) Time of peak concentration 300 400 500 import numpy as np def a( d1, d2, x1, y1, x2, y2 numerator d1 *2-d2**2 ((x1*2ty1**2)-(x22+y2**2)) denominator 2 (y2-yl) return numerator/denominator def b( x1, yl, x2, y2) return -(x2-x1)/ (y2-yl) 10 def solve xy x1, yl, x2, y2, di, d2 ) bb-b (xi,yl,x2,y2) aa-a (d1, d2,x1,yl,x2,y2) 12 pre 2(x1-bb (aa-y1)) den"2* (1+bb*+2) xp (pretnp.sqrt (rad))/den xm (pre-np.sqrt(rad))/den 16 17 18 ym-aa+xm*bb return xm, ym, xp,yp 20 When your result converges to a set of coordinates for the evil point source and a value for K, this seems to show that we can use triangulation to estimate diffusivity. Of course, there are major simplifying assumptions here, most notably no wind and a very rough scaling estimate linking time to distance. Nevertheless, knowing the location of a third detector and the time of peak concentration gives us a good estimate, and we can locate the evil point source. Part 2 Objective Create a plot with the components described in the following sentences. Plot the three points at which the measurements are taken and the location of the evil point source. Make each a unique color, and label each point on the plot. Finally, draw a black, solid line from each measurement point to the evil point source. Take Home Assignment 2 ENGR 131 | Winter 2019 Use triangulation to locate a pollutant source In LAB 10.25, you developed functions for using three points and two distances to calculate the location of an unknown point. Now, let's suppose that the unknown point is actually a point source for some pollutant X, and at time 0 it releases a burst of X. Assume no wind, and that X diffuses freely from its release point. Suppose that we have measurement devices at the three points 1, 2, and 3 that track the concentration of X as a function of time, and that the concentration of X is detected to peak at times t, t2, and t3, at each point, respectively. Can we determine the location of the evil point source? Let's make the assumption that the time intervals scale with the square of the distance divided by the diffusivity of X, t This means we can invoke some unknown constant K-VDx that satisfies di-Kvti, d2- Kvt2, and ds-Kvts. Can we estimate Kuniquely knowing this? Consider that if we choose a value for K,all three distances are set, and we get the two solutions points that correspond to that value of K. We can then measure the distance to point 3 for each solution point, and see if it matches ( ht if it doesn't? Is there one unique value of K that works? The answer is yes! Consider the following algorithm: 1. Giventimes ty, t2, t3 and the points (x,.y), (xay2), and (x3.y3) 2. Guess K 3. Find the point (xy) the correct distance from both (x andV2) and closest to (x3.y3) 4. Compute the apparent distance d'3from (xy) to (x3V3) 5. Compute z 6. If z is 1, stop: otherwise let K be K/z, and go to 3. The value of K this converges to, if squared, gives an esti mate for the diffusivity Dx Part 1 Objective To the following code, add your implementation of the algorithm listed above. Then given the following coordinates and times of observed peak concentration, print the coordinates of the evil point source in the format (x,y)(including the parentheses) where x and y are floats with three digits following the decimal. Coordinates (x.y) of observation (-8.0,5.0) Time of peak concentration 300 400 500 import numpy as np def a( d1, d2, x1, y1, x2, y2 numerator d1 *2-d2**2 ((x1*2ty1**2)-(x22+y2**2)) denominator 2 (y2-yl) return numerator/denominator def b( x1, yl, x2, y2) return -(x2-x1)/ (y2-yl) 10 def solve xy x1, yl, x2, y2, di, d2 ) bb-b (xi,yl,x2,y2) aa-a (d1, d2,x1,yl,x2,y2) 12 pre 2(x1-bb (aa-y1)) den"2* (1+bb*+2) xp (pretnp.sqrt (rad))/den xm (pre-np.sqrt(rad))/den 16 17 18 ym-aa+xm*bb return xm, ym, xp,yp 20 When your result converges to a set of coordinates for the evil point source and a value for K, this seems to show that we can use triangulation to estimate diffusivity. Of course, there are major simplifying assumptions here, most notably no wind and a very rough scaling estimate linking time to distance. Nevertheless, knowing the location of a third detector and the time of peak concentration gives us a good estimate, and we can locate the evil point source. Part 2 Objective Create a plot with the components described in the following sentences. Plot the three points at which the measurements are taken and the location of the evil point source. Make each a unique color, and label each point on the plot. Finally, draw a black, solid line from each measurement point to the evil point source