Hi,
With the excel file provided, please help me determine the following.
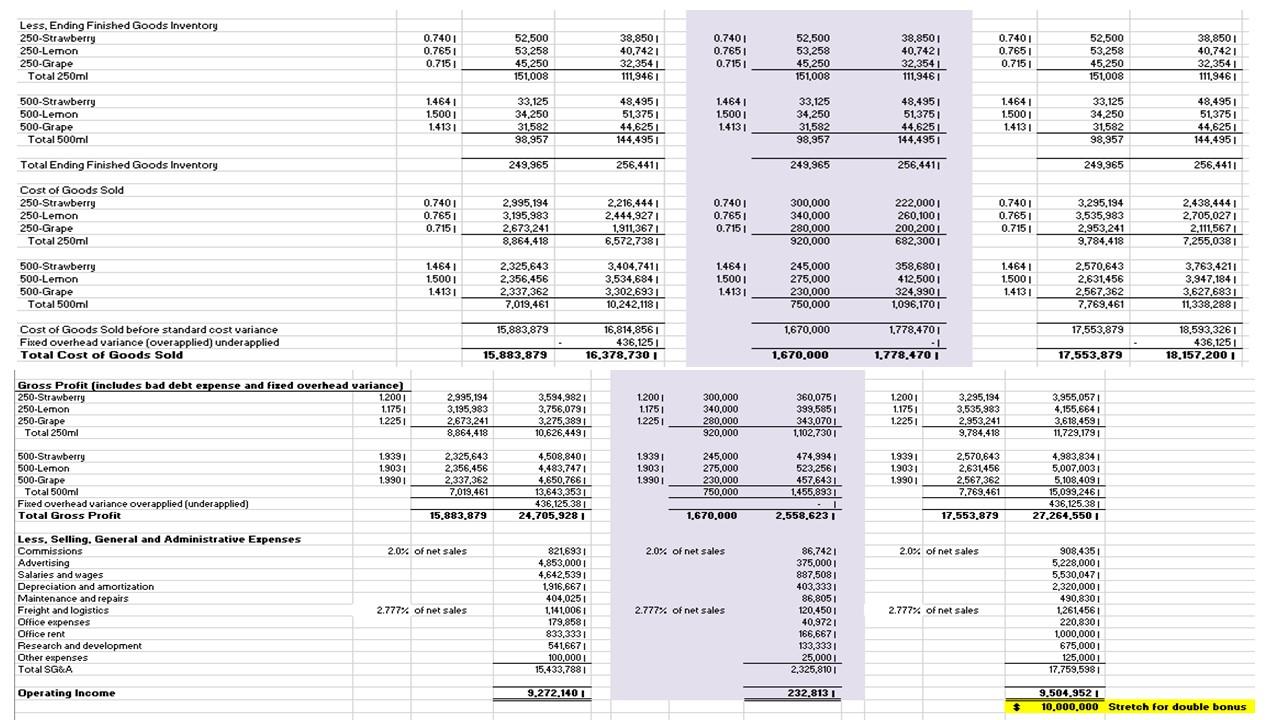
- What percentage increase in sales (November/December) would be required to exceed the Euro 10 million operating income threshold (assuming that standard unit cost stay constant)?
- What percentage increase in production (November/December) would be required to exceed the Euro 10 million operating income threshold (assuming that standard unit cost stay constant)?
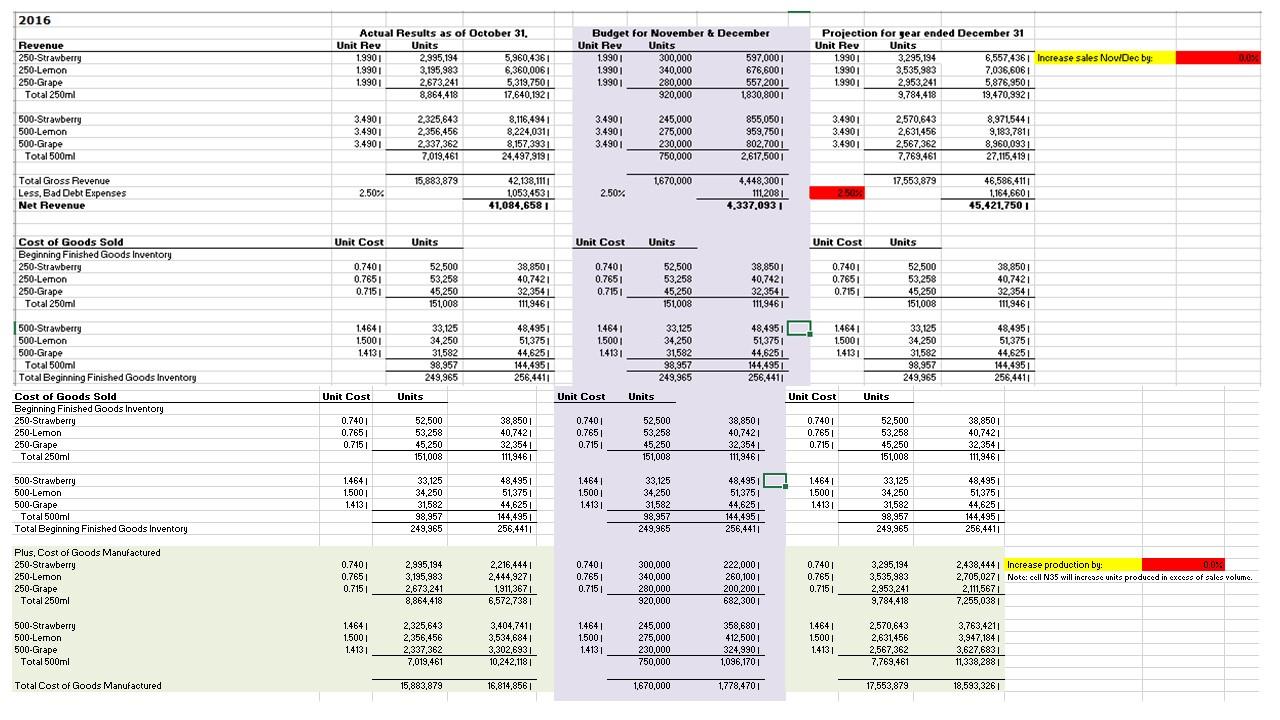
2016 0.0 Revenue 250-Strawberry 250-Lemon 250-Grape Total 250ml Actual Results as of October 31, Unit Rev Units 1.9901 2,995,194 5,960.4361 1.9901 3,195,983 6,360,0061 1.9901 2,673,241 5,319,7501 8.864,418 17,640,1921 Budget for November & December Unit Rev Units 1.9901 300,000 597,0001 1.9901 340,000 676,6001 1.9901 280,000 557.2001 920,000 1.830,8001 Projection for gear ended December 31 Unit Rev Units 1.9901 3,295,194 6,557.4361 Increase sales Now Dec by: 1.9901 3,535,983 7,036,6061 1.9901 2.953,241 5,876,9501 9,784.418 19,470,9921 500-Strawberry 500-Lemon 500-Grape Total 500ml 3.4901 3.4901 3.4901 2,325,643 2,356,456 2,337,362 7,019,461 8,116,4941 8,224.0311 8,157,3931 24,497,9191 3.4901 3.4901 3.4901 245,000 275,000 230,000 750,000 855,0501 959,7501 802.7001 2,617,5001 3.4901 3.4901 3.4901 2,570,643 2,631456 2,567,362 7,769,461 8,971,5441 9,183,7811 8,960,0931 27.115,4191 15,883,879 1670,000 17,553,879 Total Gross Revenue Less, Bad Debt Expenses Net Revenue 2.50% 42,138,1111 1.053.4531 41,084.6581 2.50% 4,448,3001 111,2081 4,337,093 46,586,4111 1.164.6601 45.421,750 Unit Cost Units Unit Cost Units Unit Cost Units Cost of Goods Sold Beginning Finished Goods Inventory 250-Strawberry 250-Lemon 250-Grape Total 250ml 0.7401 0.7651 0.7151 52,500 53,258 45,250 151,008 38,8501 40,7421 32,3541 111.9461 0.7401 0.7651 0.7151 52,500 53,258 45,250 151,008 38,8501 40,7421 32,354 111,9461 0.7401 0.7651 0.7151 52.500 53,258 45,250 151.008 38,8501 40,7421 32,3541 111,9461 1.4641 1.5001 1.4131 33,125 34,250 31,582 98,957 249,965 48,4951 51,3751 44,6251 144.4951 256,4411 1.4641 1.5001 1.4131 33,125 34,250 31.582 98,957 249,965 48.4951 1.4641 513751 15001 44,6251 1.4131 144,4951 256,4411 Unit Cost Units 33,125 34,250 31.582 98,957 249,965 500-Strawberry 500-Lemon 500-Grape Total 500ml Total Beginning Finished Goods Inventory Cost of Goods Sold Beginning Finished Goods Inventory 250-Strawberry 250-Lemon 250-Grape Total 250ml 48,495 51,3751 44,6251 144,4951 256,4411 Unit Cost Units Unit Cost Units 38,8501 0.7401 0.7651 0.7151 52,500 53,258 45,250 151,008 38,8501 40,7421 32,3541 111,9461 0.7401 0.7651 0.7151 40.7421 52,500 53,258 45,250 151,008 38,8501 40,7421 32,354 111,9461 0.7401 0.7651 0.7151 52,500 53,258 45,250 151,008 32,354 111.9461 500-Strawberry 500-Lemon 500-Grape Total 500ml Total Beginning Finished Goods Inventory 1.4641 1.5001 1.4131 33,125 34,250 31,582 98,957 249,965 48,4951 51,3751 44,6251 144,495 256,4411 1.4641 1.5001 1.4131 33,125 34,250 31,582 98,957 249,965 48,4951 51,3751 44,625 144,4951 256,4411 1.4641 1.5001 1.4131 33,125 34,250 31,582 98,957 249,965 48,4951 51,3751 44,6251 144,495 256,4411 Plus, Cost of Goods Manufactured 250-Strawberry 250-Lemon 250-Grape Total 250ml 0.7401 0.7651 0.7151 2,995,194 3,195,983 2,673,241 8,864,418 2,216,4441 2,444,9271 1,911,367 6,572,7381 0.7401 0.7651 0.7151 300,000 340,000 280,000 920,000 222.000 260,1001 200,2001 682,3001 0.7401 0.7651 0.7151 3,295,194 3,535,983 2,953,241 9,784,418 2,438,444 | Increase production by: 00% 2,705,027 Note: cell N35 will increase units produced in excess of sales volume. 2,111,5671 7,255,0381 500-Strawberry 500-Lemon 500-Grape Total 500ml 1.4641 1.5001 1.4131 2.325,643 2,356,456 2,337,362 7,019,461 3,404,7411 3,534,6841 3,302,6931 10,242,1181 1.4641 1.5001 1.4131 245,000 275,000 230,000 750,000 358,6801 412,5001 324,9901 1,096,1701 1.4641 1.5001 1.4131 2,570,643 2,631,456 2,567,362 3,763,4211 3.947,1841 3,627,6831 11,338,2881 7,769,461 Total Cost of Goods Manufactured 15,883,879 16,814,8561 1,670,000 1,778,4701 17,553,879 18,583,3261 Less, Ending Finished Goods Inventory 250-Strawberry 250-Lemon 250-Grape Total 250ml 0.7401 0.7651 0.7151 52,500 53,258 45,250 151,008 38,8501 40,7421 32,3541 111,9461 0.7401 0.7651 0.7151 52,500 53,258 45.250 151,008 38,8501 40.7421 32.3541 111.9461 0.7401 0.7651 0.7151 52,500 53,258 45,250 151,008 38,8501 40.7421 32,3541 111.9461 500-Strawberry 500-Lemon 500-Grape Total 500ml 1.4641 1.5001 1.4131 33,125 34,250 31,582 98.957 48,4951 51,3751 44,6251 144,4951 1.4641 15001 1.4131 33,125 34,250 31,582 98,957 48,4951 51,3751 44,6251 144.4951 1.4641 1.5001 1.4131 33,125 34.250 31,582 98,957 48,4951 51,3751 44.6251 144,4951 Total Ending Finished Goods Inventory 249,965 256,4411 249.965 256,4411 249,965 256,4411 Cost of Goods Sold 250-Strawberry 250-Lemon 250-Grape Total 250ml 0.7401 0.7651 0.7151 2.995,194 3,195,983 2.673,241 8,864,418 2,216,4441 2.444,9271 1,911,3671 6,572,7381 0.7401 0.7651 0.715 300.000 340,000 280,000 920,000 222,000 260,1001 200,2001 682,3001 0.7401 0.7651 0.715 3.295,194 3.535.983 2,953,241 9,784,418 2,438,4441 2.705.0271 2.111,5671 7,255,0381 1.4641 1.5001 1.4131 2.325,643 2,356,456 2.337.362 7,019,461 3,404,741 3,534,6841 3,302.6931 10,242,1181 1.4841 15001 1.4131 245,000 275.000 230,000 358,6801 412,5001 324,9901 1,096,1701 1.4641 1.500 1.4131 500-Strawberry 500-Lemon 500-Grape Total 500ml Cost of Goods Sold before standard cost variance Fixed overhead variance (overapplied) under applied Total Cost of Goods Sold 2,570,643 2.631.456 2.567.362 7,769,461 3,763,4211 3.947.1841 3.627.6831 11,338,2881 750,000 15,883.879 1,670,000 17,553,879 16,814,8561 436,125 16.378.730 1,778.4701 - 1 1.778.470 18,593,3261 436,1251 18.157.2001 15,883,879 1,670,000 17.553.879 2.995,194 3.195,983 2.673,241 8,864,418 3,594,9821 3.756.0791 3.275,3891 10,626,4491 1.2001 1.1751 1.2251 300,000 340,000 280.000 920,000 360,0751 399,5851 343.0701 1.2001 1.1751 1.2251 3,295,194 3,535,983 2.953,241 9,784,418 3.955,0571 4.155.6641 3,618,4591 11,729,1791 1,102,7301 Gross Profit (includes bad debt expense and fixed overhead variance) 1.2001 250-Strawberry 1.1751 250 Lemon 1.2251 250-Grape Total 250ml 1.9391 500-Strawberry 1.9031 500-Lemon 1.990 500-Grape Total 500ml Fixed overhead variance overapplied (underapplied) Total Gross Profit 2,325,643 2,356,456 2.337.362 7,019,461 19391 1.9031 1.9901 4,508,8401 4,483,7471 4,650,7661 13,643,353 436,125,38 24,705,9281 245,000 275,000 230,000 750,000 1.9391 1.9031 1.9901 474,994 1 523.2561 457.6431 1.455.8931 1 2.558,6231 2,570,643 2.631.456 2,567,362 7.769,461 4.983,8341 5,007,0031 5,108,4091 15.099,2461 436,125.381 27.264.5501 15,883,879 1,670,000 17.553,879 2.0% of net sales 2.0% of net sales 2.0% of net sales Less. Selling. General and Administrative Expenses Commissions Advertising Salaries and wages Depreciation and amortization Maintenance and repairs Freight and logistics Office expenses Office rent Research and development Other expenses Total SG&A 2.777% of net sales 821,6931 4,853,000 4,642,5391 1,916,6671 404.0251 1,141,006 179,8581 833,3331 541,6671 100,0001 15,433,7881 2.777% of net sales 86,7421 375,000 887,5081 403,3331 86,8051 120.4501 40.9721 166.6671 133,3331 25,0001 2,325,8101 2.777% of net sales 908.4351 5.228,000 5,530.0471 2,320,000 490,8301 1,261,4561 220,8301 1,000,000 675,000 125,000 17.759,5981 Operating Income 9.272,1401 232.8131 9.504.9521 10,000,000 Stretch for double bonus $ 2016 0.0 Revenue 250-Strawberry 250-Lemon 250-Grape Total 250ml Actual Results as of October 31, Unit Rev Units 1.9901 2,995,194 5,960.4361 1.9901 3,195,983 6,360,0061 1.9901 2,673,241 5,319,7501 8.864,418 17,640,1921 Budget for November & December Unit Rev Units 1.9901 300,000 597,0001 1.9901 340,000 676,6001 1.9901 280,000 557.2001 920,000 1.830,8001 Projection for gear ended December 31 Unit Rev Units 1.9901 3,295,194 6,557.4361 Increase sales Now Dec by: 1.9901 3,535,983 7,036,6061 1.9901 2.953,241 5,876,9501 9,784.418 19,470,9921 500-Strawberry 500-Lemon 500-Grape Total 500ml 3.4901 3.4901 3.4901 2,325,643 2,356,456 2,337,362 7,019,461 8,116,4941 8,224.0311 8,157,3931 24,497,9191 3.4901 3.4901 3.4901 245,000 275,000 230,000 750,000 855,0501 959,7501 802.7001 2,617,5001 3.4901 3.4901 3.4901 2,570,643 2,631456 2,567,362 7,769,461 8,971,5441 9,183,7811 8,960,0931 27.115,4191 15,883,879 1670,000 17,553,879 Total Gross Revenue Less, Bad Debt Expenses Net Revenue 2.50% 42,138,1111 1.053.4531 41,084.6581 2.50% 4,448,3001 111,2081 4,337,093 46,586,4111 1.164.6601 45.421,750 Unit Cost Units Unit Cost Units Unit Cost Units Cost of Goods Sold Beginning Finished Goods Inventory 250-Strawberry 250-Lemon 250-Grape Total 250ml 0.7401 0.7651 0.7151 52,500 53,258 45,250 151,008 38,8501 40,7421 32,3541 111.9461 0.7401 0.7651 0.7151 52,500 53,258 45,250 151,008 38,8501 40,7421 32,354 111,9461 0.7401 0.7651 0.7151 52.500 53,258 45,250 151.008 38,8501 40,7421 32,3541 111,9461 1.4641 1.5001 1.4131 33,125 34,250 31,582 98,957 249,965 48,4951 51,3751 44,6251 144.4951 256,4411 1.4641 1.5001 1.4131 33,125 34,250 31.582 98,957 249,965 48.4951 1.4641 513751 15001 44,6251 1.4131 144,4951 256,4411 Unit Cost Units 33,125 34,250 31.582 98,957 249,965 500-Strawberry 500-Lemon 500-Grape Total 500ml Total Beginning Finished Goods Inventory Cost of Goods Sold Beginning Finished Goods Inventory 250-Strawberry 250-Lemon 250-Grape Total 250ml 48,495 51,3751 44,6251 144,4951 256,4411 Unit Cost Units Unit Cost Units 38,8501 0.7401 0.7651 0.7151 52,500 53,258 45,250 151,008 38,8501 40,7421 32,3541 111,9461 0.7401 0.7651 0.7151 40.7421 52,500 53,258 45,250 151,008 38,8501 40,7421 32,354 111,9461 0.7401 0.7651 0.7151 52,500 53,258 45,250 151,008 32,354 111.9461 500-Strawberry 500-Lemon 500-Grape Total 500ml Total Beginning Finished Goods Inventory 1.4641 1.5001 1.4131 33,125 34,250 31,582 98,957 249,965 48,4951 51,3751 44,6251 144,495 256,4411 1.4641 1.5001 1.4131 33,125 34,250 31,582 98,957 249,965 48,4951 51,3751 44,625 144,4951 256,4411 1.4641 1.5001 1.4131 33,125 34,250 31,582 98,957 249,965 48,4951 51,3751 44,6251 144,495 256,4411 Plus, Cost of Goods Manufactured 250-Strawberry 250-Lemon 250-Grape Total 250ml 0.7401 0.7651 0.7151 2,995,194 3,195,983 2,673,241 8,864,418 2,216,4441 2,444,9271 1,911,367 6,572,7381 0.7401 0.7651 0.7151 300,000 340,000 280,000 920,000 222.000 260,1001 200,2001 682,3001 0.7401 0.7651 0.7151 3,295,194 3,535,983 2,953,241 9,784,418 2,438,444 | Increase production by: 00% 2,705,027 Note: cell N35 will increase units produced in excess of sales volume. 2,111,5671 7,255,0381 500-Strawberry 500-Lemon 500-Grape Total 500ml 1.4641 1.5001 1.4131 2.325,643 2,356,456 2,337,362 7,019,461 3,404,7411 3,534,6841 3,302,6931 10,242,1181 1.4641 1.5001 1.4131 245,000 275,000 230,000 750,000 358,6801 412,5001 324,9901 1,096,1701 1.4641 1.5001 1.4131 2,570,643 2,631,456 2,567,362 3,763,4211 3.947,1841 3,627,6831 11,338,2881 7,769,461 Total Cost of Goods Manufactured 15,883,879 16,814,8561 1,670,000 1,778,4701 17,553,879 18,583,3261 Less, Ending Finished Goods Inventory 250-Strawberry 250-Lemon 250-Grape Total 250ml 0.7401 0.7651 0.7151 52,500 53,258 45,250 151,008 38,8501 40,7421 32,3541 111,9461 0.7401 0.7651 0.7151 52,500 53,258 45.250 151,008 38,8501 40.7421 32.3541 111.9461 0.7401 0.7651 0.7151 52,500 53,258 45,250 151,008 38,8501 40.7421 32,3541 111.9461 500-Strawberry 500-Lemon 500-Grape Total 500ml 1.4641 1.5001 1.4131 33,125 34,250 31,582 98.957 48,4951 51,3751 44,6251 144,4951 1.4641 15001 1.4131 33,125 34,250 31,582 98,957 48,4951 51,3751 44,6251 144.4951 1.4641 1.5001 1.4131 33,125 34.250 31,582 98,957 48,4951 51,3751 44.6251 144,4951 Total Ending Finished Goods Inventory 249,965 256,4411 249.965 256,4411 249,965 256,4411 Cost of Goods Sold 250-Strawberry 250-Lemon 250-Grape Total 250ml 0.7401 0.7651 0.7151 2.995,194 3,195,983 2.673,241 8,864,418 2,216,4441 2.444,9271 1,911,3671 6,572,7381 0.7401 0.7651 0.715 300.000 340,000 280,000 920,000 222,000 260,1001 200,2001 682,3001 0.7401 0.7651 0.715 3.295,194 3.535.983 2,953,241 9,784,418 2,438,4441 2.705.0271 2.111,5671 7,255,0381 1.4641 1.5001 1.4131 2.325,643 2,356,456 2.337.362 7,019,461 3,404,741 3,534,6841 3,302.6931 10,242,1181 1.4841 15001 1.4131 245,000 275.000 230,000 358,6801 412,5001 324,9901 1,096,1701 1.4641 1.500 1.4131 500-Strawberry 500-Lemon 500-Grape Total 500ml Cost of Goods Sold before standard cost variance Fixed overhead variance (overapplied) under applied Total Cost of Goods Sold 2,570,643 2.631.456 2.567.362 7,769,461 3,763,4211 3.947.1841 3.627.6831 11,338,2881 750,000 15,883.879 1,670,000 17,553,879 16,814,8561 436,125 16.378.730 1,778.4701 - 1 1.778.470 18,593,3261 436,1251 18.157.2001 15,883,879 1,670,000 17.553.879 2.995,194 3.195,983 2.673,241 8,864,418 3,594,9821 3.756.0791 3.275,3891 10,626,4491 1.2001 1.1751 1.2251 300,000 340,000 280.000 920,000 360,0751 399,5851 343.0701 1.2001 1.1751 1.2251 3,295,194 3,535,983 2.953,241 9,784,418 3.955,0571 4.155.6641 3,618,4591 11,729,1791 1,102,7301 Gross Profit (includes bad debt expense and fixed overhead variance) 1.2001 250-Strawberry 1.1751 250 Lemon 1.2251 250-Grape Total 250ml 1.9391 500-Strawberry 1.9031 500-Lemon 1.990 500-Grape Total 500ml Fixed overhead variance overapplied (underapplied) Total Gross Profit 2,325,643 2,356,456 2.337.362 7,019,461 19391 1.9031 1.9901 4,508,8401 4,483,7471 4,650,7661 13,643,353 436,125,38 24,705,9281 245,000 275,000 230,000 750,000 1.9391 1.9031 1.9901 474,994 1 523.2561 457.6431 1.455.8931 1 2.558,6231 2,570,643 2.631.456 2,567,362 7.769,461 4.983,8341 5,007,0031 5,108,4091 15.099,2461 436,125.381 27.264.5501 15,883,879 1,670,000 17.553,879 2.0% of net sales 2.0% of net sales 2.0% of net sales Less. Selling. General and Administrative Expenses Commissions Advertising Salaries and wages Depreciation and amortization Maintenance and repairs Freight and logistics Office expenses Office rent Research and development Other expenses Total SG&A 2.777% of net sales 821,6931 4,853,000 4,642,5391 1,916,6671 404.0251 1,141,006 179,8581 833,3331 541,6671 100,0001 15,433,7881 2.777% of net sales 86,7421 375,000 887,5081 403,3331 86,8051 120.4501 40.9721 166.6671 133,3331 25,0001 2,325,8101 2.777% of net sales 908.4351 5.228,000 5,530.0471 2,320,000 490,8301 1,261,4561 220,8301 1,000,000 675,000 125,000 17.759,5981 Operating Income 9.272,1401 232.8131 9.504.9521 10,000,000 Stretch for double bonus $