Answered step by step
Verified Expert Solution
Link Copied!

Question

1 Approved Answer

Histogram of Pharmacist Salaries Frequency 1500 2000 2500 1000 500 1 T T T T T 1 60000 80000 100000 120000 140000 160000 salaries Pictured
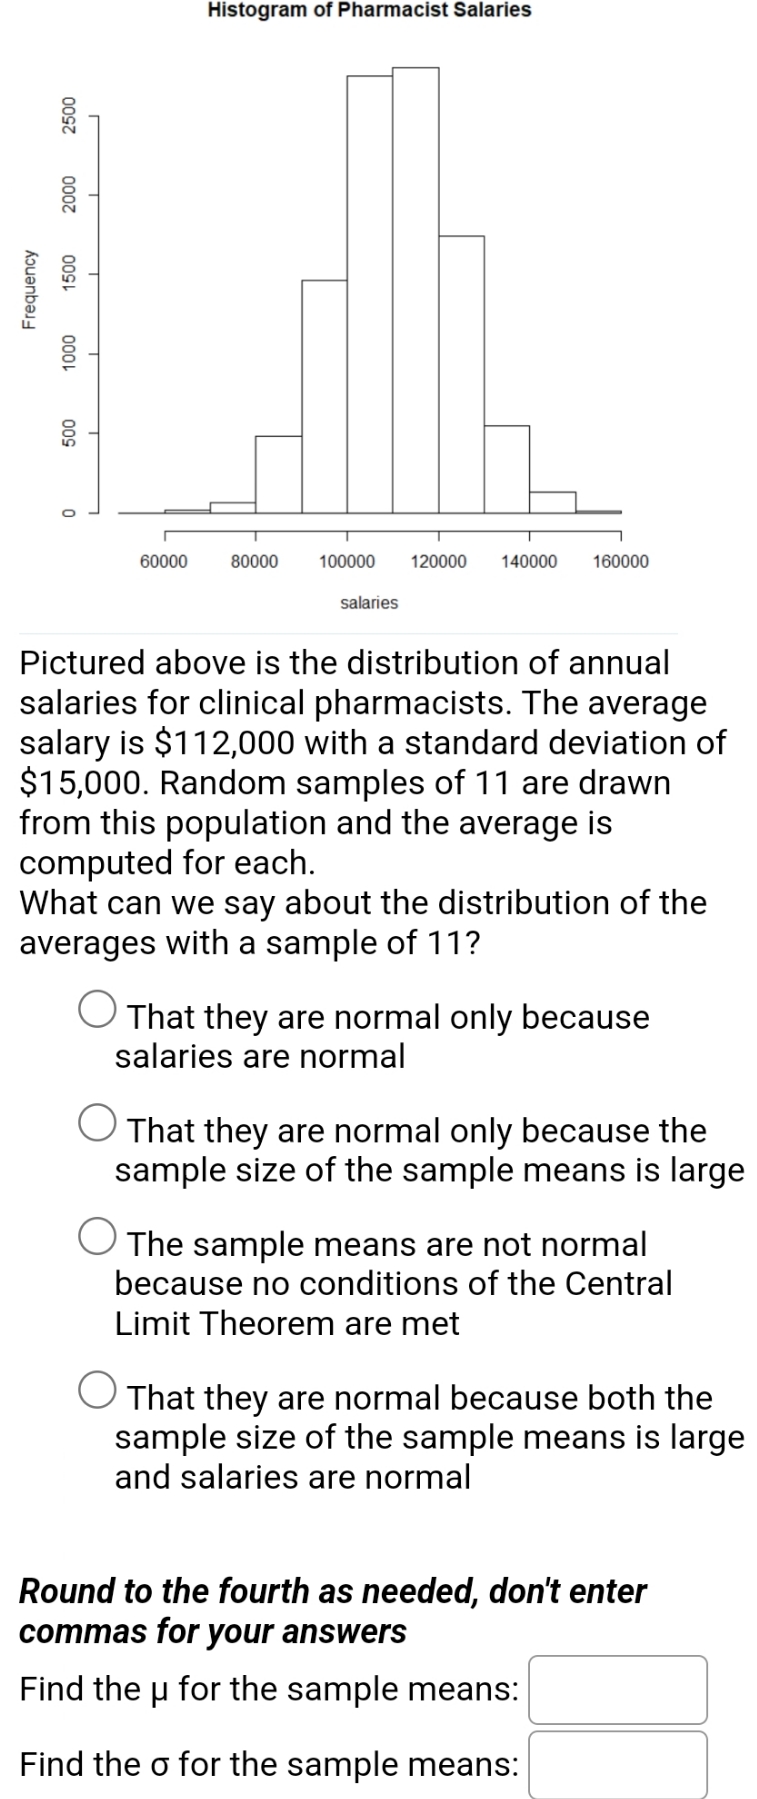
image text in transcribed
Histogram of Pharmacist Salaries Frequency 1500 2000 2500 1000 500 1 T T T T T 1 60000 80000 100000 120000 140000 160000 salaries Pictured above is the distribution of annual salaries for clinical pharmacists. The average salary is $112,000 with a standard deviation of $15,000. Random samples of 11 are drawn from this population and the average is computed for each. What can we say about the distribution of the averages with a sample of 11? O That they are normal only because salaries are normal O That they are normal only because the sample size of the sample means is large O The sample means are not normal because no conditions of the Central Limit Theorem are met O That they are normal because both the sample size of the sample means is large and salaries are normal Round to the fourth as needed, don't enter commas for your answers Find the p for the sample means: | Find the o for the sample means: |

Step by Step Solution

There are 3 Steps involved in it

Step: 1

blur-text-image

Get Instant Access to Expert-Tailored Solutions

See step-by-step solutions with expert insights and AI powered tools for academic success

Step: 2

blur-text-image

Step: 3

blur-text-image

Ace Your Homework with AI

Get the answers you need in no time with our AI-driven, step-by-step assistance

Get Started

Recommended Textbook for

Prealgebra

Authors: Elayn Martin Gay

7th edition

321955048, 978-0321955043

More Books

Students also viewed these Mathematics questions

Question

Explain in detail how the Mughal Empire was established in India

Answered: 1 week ago

Question

Problem: Evaluate the integral: I - -[ze dx

Answered: 1 week ago

Question

Problem: Evaluate the integral: I = 1- 1 dx 9

Answered: 1 week ago