Answered step by step
Verified Expert Solution
Link Copied!

Question

1 Approved Answer

Histograms and Random Noise 1. Obtain the histograms of the three images you identified in HW #1 - Part I. (Histograms should have 256 brightness

Histograms and Random Noiseimage text in transcribed

1. Obtain the histograms of the three images you identified in HW #1 - Part I. (Histograms should have 256 brightness levels along the horizontal axis and, frequency of occurrence of each of the brightness levels along the vertical axis. 2. Comment on the differences in the histograms of the three images, and explain the differences in distributions. 3. Select a threshold values to convert the images into a binary images using their respective histogram. Justify your selections. 4. Select two threshold values for each image to convert the images into three gray levels. Justify your selection of threshold values from the histogram. 5. Obtain a binary image using the threshold value in 3 for ONE OF THE IMAGES. Comment on your results. 6. Obtain a 3-gray-level image for the same image in 5. using the threshold values identified in 4. Comment on your results. 7. Produce a noise image with normally distributed noise with sigma = 0.1. Plot the noise image. 8. Produce a noise image with normally distributed noise with sigma 0.5. Plot the noise image. 9. Add the noise generated in 7. and 8. to your original three images SEPARATELY. Comment on the resuls. 1. Obtain the histograms of the three images you identified in HW #1 - Part I. (Histograms should have 256 brightness levels along the horizontal axis and, frequency of occurrence of each of the brightness levels along the vertical axis. 2. Comment on the differences in the histograms of the three images, and explain the differences in distributions. 3. Select a threshold values to convert the images into a binary images using their respective histogram. Justify your selections. 4. Select two threshold values for each image to convert the images into three gray levels. Justify your selection of threshold values from the histogram. 5. Obtain a binary image using the threshold value in 3 for ONE OF THE IMAGES. Comment on your results. 6. Obtain a 3-gray-level image for the same image in 5. using the threshold values identified in 4. Comment on your results. 7. Produce a noise image with normally distributed noise with sigma = 0.1. Plot the noise image. 8. Produce a noise image with normally distributed noise with sigma 0.5. Plot the noise image. 9. Add the noise generated in 7. and 8. to your original three images SEPARATELY. Comment on the resuls

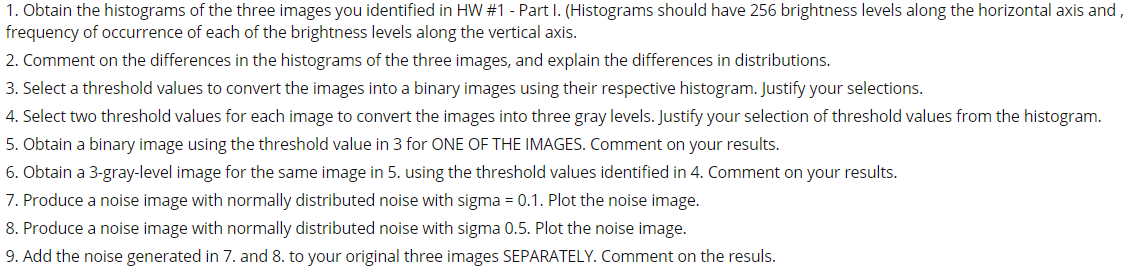
Step by Step Solution

There are 3 Steps involved in it

Step: 1

blur-text-image

Get Instant Access to Expert-Tailored Solutions

See step-by-step solutions with expert insights and AI powered tools for academic success

Step: 2

blur-text-image

Step: 3

blur-text-image

Ace Your Homework with AI

Get the answers you need in no time with our AI-driven, step-by-step assistance

Get Started

Recommended Textbook for

SQL Server Query Performance Tuning

Authors: Sajal Dam, Grant Fritchey

4th Edition

1430267429, 9781430267423

More Books

Students also viewed these Databases questions