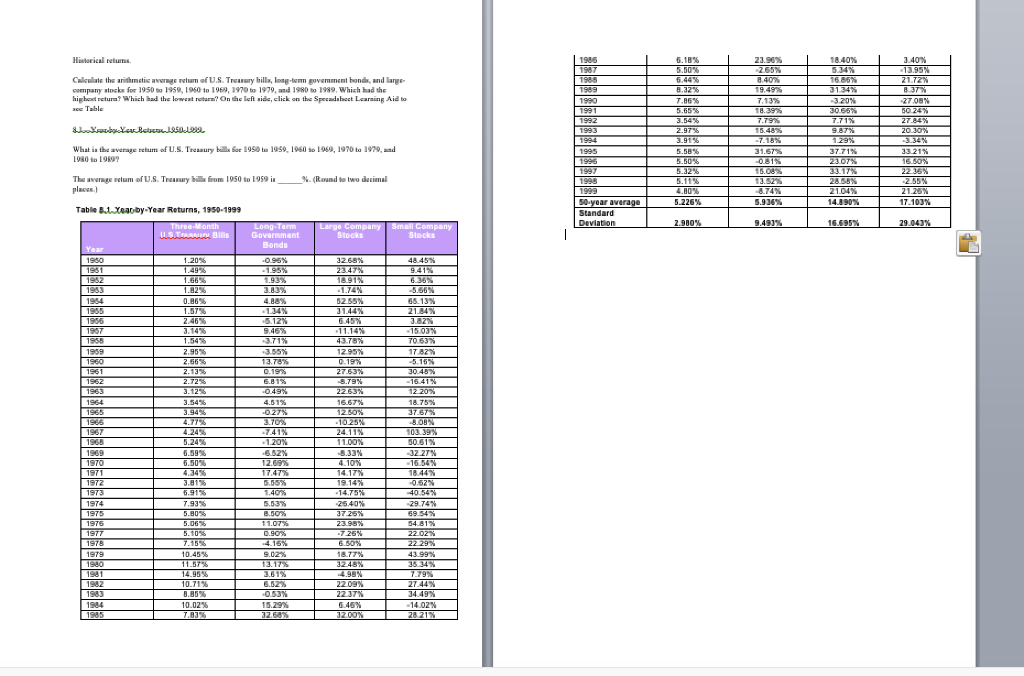
Historical 18.40% 5.34% 3.40% -13.95 21.72N Calculate the arithmetic were return of U.S. Treasury bills, long-term govemment bands, and large- company stocks for 1950 to 1959, 1960 to 1969, 1970 to 1979, and 1990 to 1989. Which had the highest return? Which had the lowest return? On the left side, click on the Specadoheet Learning Aid to Es Table 1985 1987 1983 1989 1990 1991 1992 1993 6.10% 5.50% 6.445 8.32% 7.86% 5.55% 3.54 3.54% 2.97% 23.90% 265% 8.40% 19.49% 7.13% 18.39% 7.79% 15.48% -27.08% 50 24% 27.84% 20.30% Bobkex Bros. What is the average retum of U.S. Treasury balls for 1950 to 1959. 1960 to 1969, 1970 to 1979. ud 31.67% 1995 1995 1030 to 1999 -3.20% 306% 7.71% 9.87% 1.29% 37.71% 2307 33.17% 28.58% 21.04% 14.890% 5.58% 5.60% 16.08 The wegentum of U.S. Truy from 1950 to 1959 in %. (Round to two decimal places 33.21% 16.30X 2236% -2.55% 21.25% 17.103% 5.119 4.80% 5.226% 1999 50-year average Standard Deviation -8.74% 5.936% 2.980% 16.695% 29.043% Large Company Small Company Stocks Stocks Long-Term Government Bonds -0.95% 48.45% 3268% 23.47% 1891% 1.93% 2.00% 4.88% Table 8.1 Yearby-Year Returns, 1950-1999 Three-Month USTAR Bills Year 1950 1.206 1981 1962 1.66% 1.82% 1954 0.86% 1955 1956 2.46% 1957 3.14% 1956 1.54% 1959 2.95% 1 sao 1960 2.56% 1961 2.13% 1962 1963 3.1256 3.12 1964 3.5456 1965 32.55% 31.44% 6.45% -6.12 9.46% 6.36 -5.56% 66.13% 21.14% 3.82% - 15.03% 70.63% 17 82% -5.16% 30.45% - 16.41% 12. 20% 18.75% 37.67% 43.75% 12 95% 0.19% 27663% -8.79% 22.63% 16.67% 12.30X 10.25W 24.11% 11.00% -8.33% 4.10% 13.78% % 0.1977 6.81% -0.49% 4.51% -0.27% 3.70 -7.41% -1.20% -6.62% 12.6978 1967 1966 1969 1970 1971 1972 1973 1974 1975 1975 1977 1975 1979 190 1981 1982 4.245 5.246 5.59% 6.50% 4.34% 3.81% 5.9136 7.93% 5.80% 5.066 5.1038 7.1556 10.45% 11.57% 14,36% 10.71% B6% 10.02% 7.833 5.55% 1.40% 5.53% 8.50% 11.07 0.10% 4.15% 9.02% 13.17% 102.39% 50.61% 32.27 -16.54 18.44% % -0.52% 40.54% 29.74% 69.54% 54.81% 22.02% 22.29% 43.99% -25.40% 3725% 23.95% -7.26% 6.30% 18.77% 3240% 490% 2209N 2237 6.46% 3200N 7.79% 27.44% 1984 1985 083N 15.29% 32.68% 14.02 28 21% Historical 18.40% 5.34% 3.40% -13.95 21.72N Calculate the arithmetic were return of U.S. Treasury bills, long-term govemment bands, and large- company stocks for 1950 to 1959, 1960 to 1969, 1970 to 1979, and 1990 to 1989. Which had the highest return? Which had the lowest return? On the left side, click on the Specadoheet Learning Aid to Es Table 1985 1987 1983 1989 1990 1991 1992 1993 6.10% 5.50% 6.445 8.32% 7.86% 5.55% 3.54 3.54% 2.97% 23.90% 265% 8.40% 19.49% 7.13% 18.39% 7.79% 15.48% -27.08% 50 24% 27.84% 20.30% Bobkex Bros. What is the average retum of U.S. Treasury balls for 1950 to 1959. 1960 to 1969, 1970 to 1979. ud 31.67% 1995 1995 1030 to 1999 -3.20% 306% 7.71% 9.87% 1.29% 37.71% 2307 33.17% 28.58% 21.04% 14.890% 5.58% 5.60% 16.08 The wegentum of U.S. Truy from 1950 to 1959 in %. (Round to two decimal places 33.21% 16.30X 2236% -2.55% 21.25% 17.103% 5.119 4.80% 5.226% 1999 50-year average Standard Deviation -8.74% 5.936% 2.980% 16.695% 29.043% Large Company Small Company Stocks Stocks Long-Term Government Bonds -0.95% 48.45% 3268% 23.47% 1891% 1.93% 2.00% 4.88% Table 8.1 Yearby-Year Returns, 1950-1999 Three-Month USTAR Bills Year 1950 1.206 1981 1962 1.66% 1.82% 1954 0.86% 1955 1956 2.46% 1957 3.14% 1956 1.54% 1959 2.95% 1 sao 1960 2.56% 1961 2.13% 1962 1963 3.1256 3.12 1964 3.5456 1965 32.55% 31.44% 6.45% -6.12 9.46% 6.36 -5.56% 66.13% 21.14% 3.82% - 15.03% 70.63% 17 82% -5.16% 30.45% - 16.41% 12. 20% 18.75% 37.67% 43.75% 12 95% 0.19% 27663% -8.79% 22.63% 16.67% 12.30X 10.25W 24.11% 11.00% -8.33% 4.10% 13.78% % 0.1977 6.81% -0.49% 4.51% -0.27% 3.70 -7.41% -1.20% -6.62% 12.6978 1967 1966 1969 1970 1971 1972 1973 1974 1975 1975 1977 1975 1979 190 1981 1982 4.245 5.246 5.59% 6.50% 4.34% 3.81% 5.9136 7.93% 5.80% 5.066 5.1038 7.1556 10.45% 11.57% 14,36% 10.71% B6% 10.02% 7.833 5.55% 1.40% 5.53% 8.50% 11.07 0.10% 4.15% 9.02% 13.17% 102.39% 50.61% 32.27 -16.54 18.44% % -0.52% 40.54% 29.74% 69.54% 54.81% 22.02% 22.29% 43.99% -25.40% 3725% 23.95% -7.26% 6.30% 18.77% 3240% 490% 2209N 2237 6.46% 3200N 7.79% 27.44% 1984 1985 083N 15.29% 32.68% 14.02 28 21%