

Question
Historical data shows that the average annual rate of return on the S&P 500 portfolio over the past 90 years has averaged roughly 8% more
Historical data shows that the average annual rate of return on the S&P 500 portfolio over the past 90 years has averaged roughly 8% more than the Treasury bill return and that the S&P 500 standard deviation has been about 21% per year. Assume these values are representative of investors' expectations for future performance and that the current T-bill rate is 4%. Calculate the expected return and variance of portfolios invested in T-bills and the S&P 500 index with weights as follows:
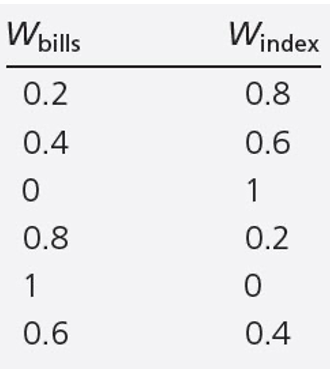
Calculate the utility levels of each portfolio with different weights for an investor with A = 2. What do you conclude? Which portfolio should the investor choose? Repeat the same for an investor with A=4.
Wbills Windex 0.2 0.8 0.4 0.6 0 1 0.8 0.2 1 0 0.6 0.4
Step by Step Solution
There are 3 Steps involved in it
Step: 1

Get Instant Access to Expert-Tailored Solutions
See step-by-step solutions with expert insights and AI powered tools for academic success
Step: 2

Step: 3
Ace Your Homework with AI
Get the answers you need in no time with our AI-driven, step-by-step assistance
Get Started
Finance A Quantitative Introduction Volume 2
Authors: Piotr Staszkiewicz, Lucia Staszkiewicz
1st Edition
0128027975, 978-0128027974