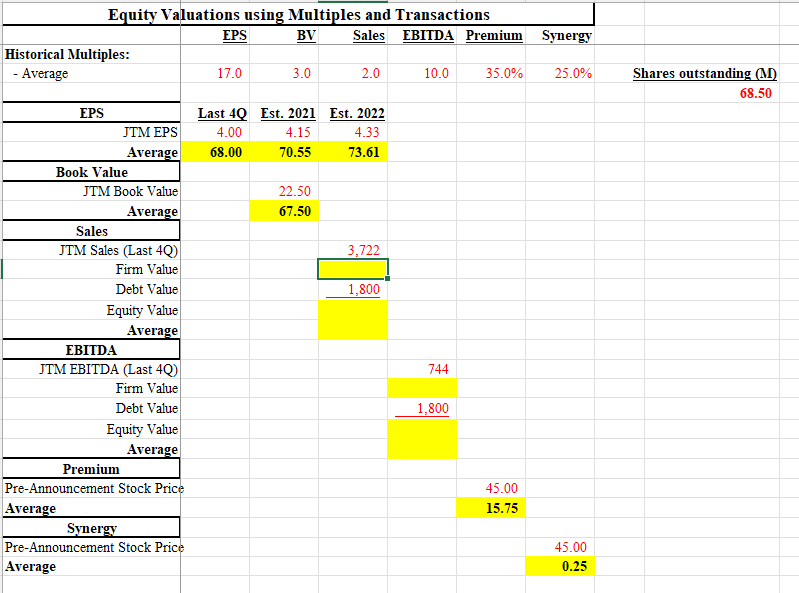
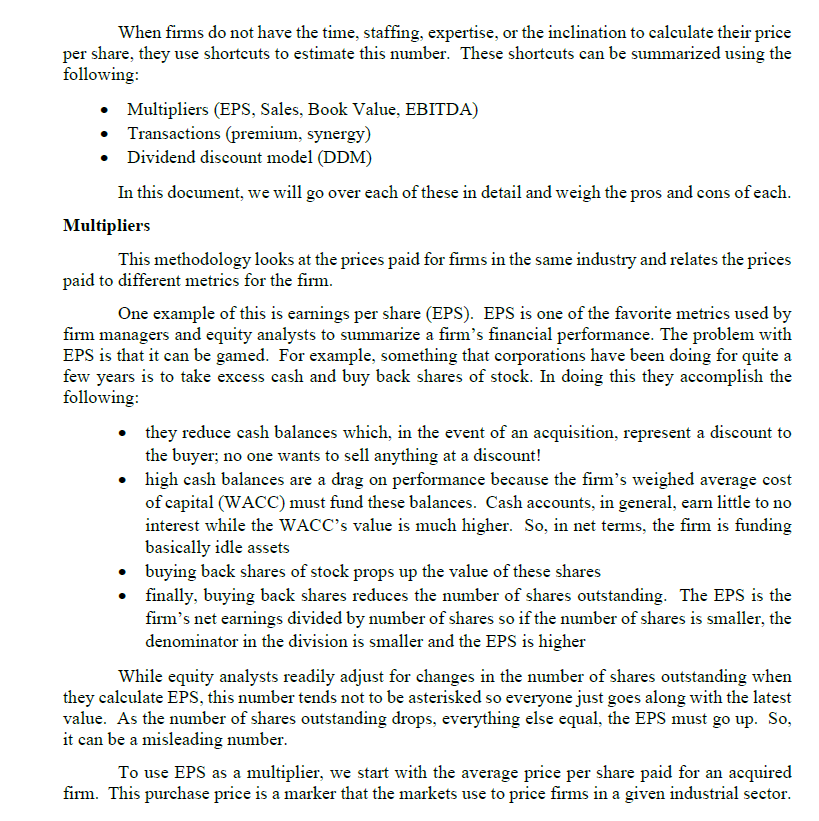
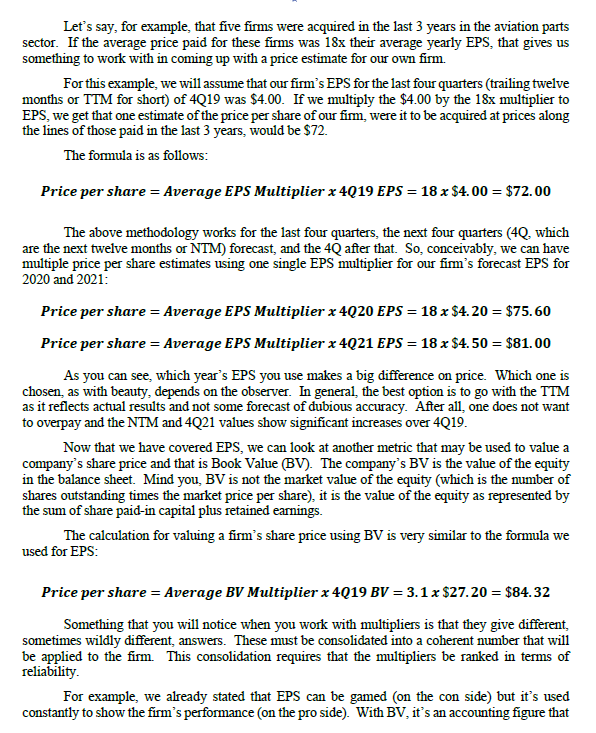
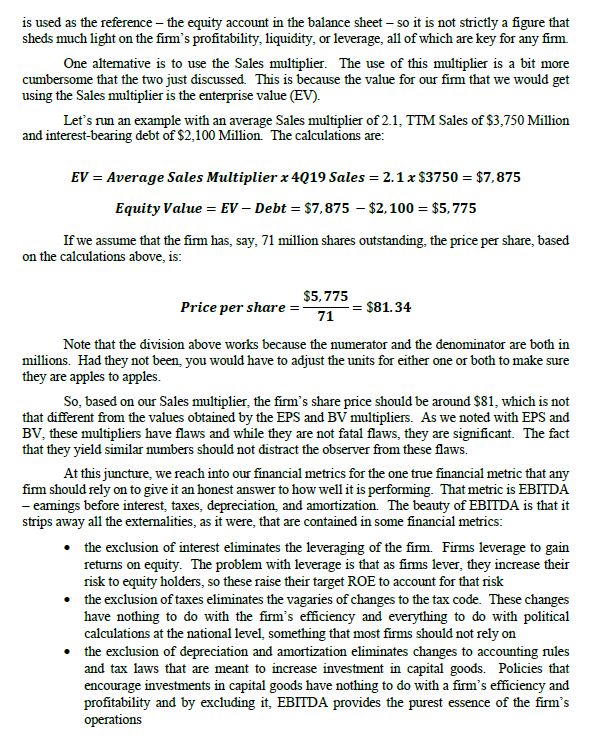
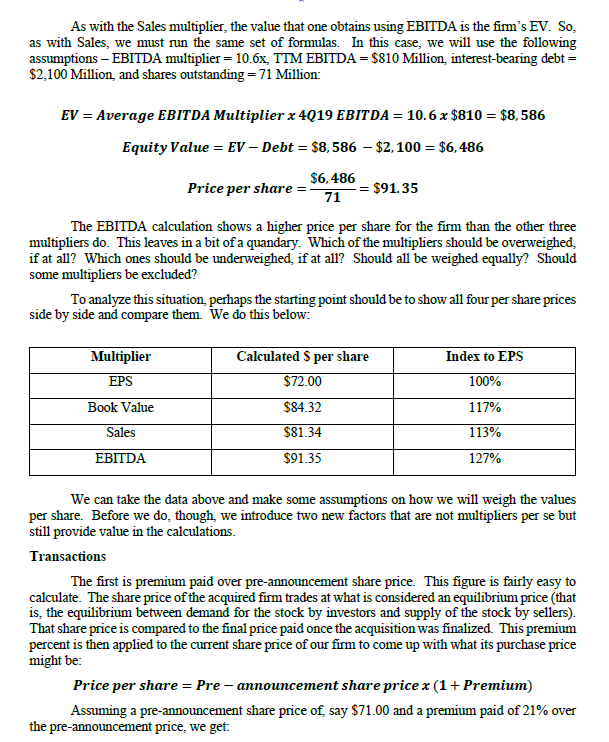
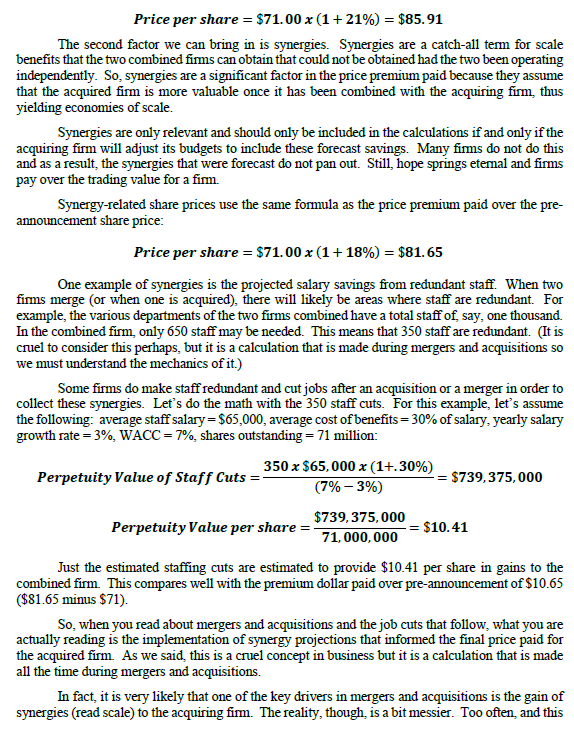
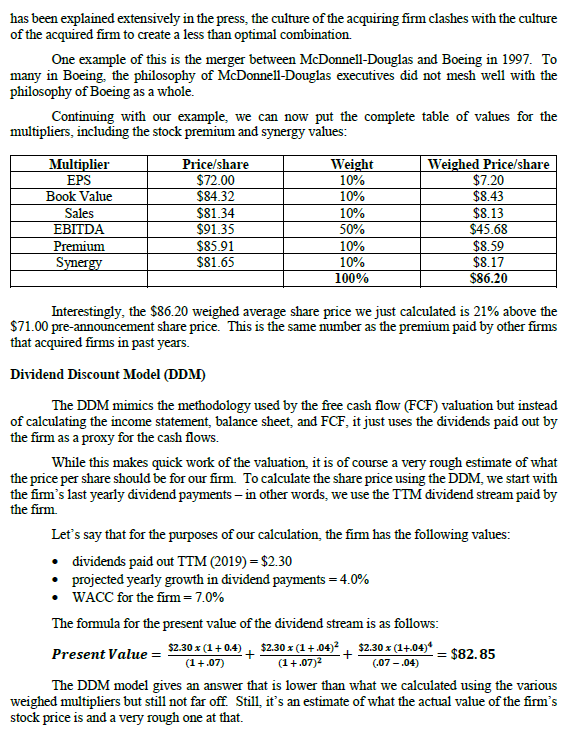
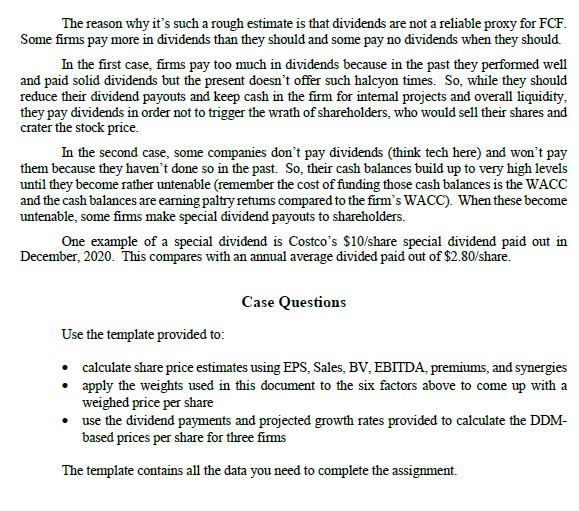
Historical Multiples: - Average Equity Valuations using Multiples and Transactions Sales EBITDA Premium Synergy BV EPS Book Value Average Average JTM EPS Average JTM Book Value Average EBITDA JTM EBITDA (Last 4Q) Firm Value Debt Value Equity Value Average Sales JTM Sales (Last 4Q) Firm Value Debt Value Equity Value Average Premium Pre-Announcement Stock Price Synergy Pre-Announcement Stock Price EPS 17.0 Last 40 4.00 68.00 3.0 Est. 2021 4.15 70.55 22.50 67.50 2.0 Est. 2022 4.33 73.61 3,722 1,800 10.0 744 1,800 35.0% 45.00 15.75 25.0% 45.00 0.25 Shares outstanding (M) 68.50 When firms do not have the time, staffing, expertise, or the inclination to calculate their price per share, they use shortcuts to estimate this number. These shortcuts can be summarized using the following: Multipliers (EPS, Sales, Book Value, EBITDA) Transactions (premium, synergy) Dividend discount model (DDM) In this document, we will go over each of these in detail and weigh the pros and cons of each. Multipliers This methodology looks at the prices paid for firms in the same industry and relates the prices paid to different metrics for the firm. One example of this is earnings per share (EPS). EPS is one of the favorite metrics used by firm managers and equity analysts to summarize a firm's financial performance. The problem with EPS is that it can be gamed. For example, something that corporations have been doing for quite a few years is to take excess cash and buy back shares of stock. In doing this they accomplish the following: they reduce cash balances which, in the event of an acquisition, represent a discount to the buyer; no one wants to sell anything at a discount! high cash balances are a drag on performance because the firm's weighed average cost of capital (WACC) must fund these balances. Cash accounts, in general, earn little to no interest while the WACC's value is much higher. So, in net terms, the firm is funding basically idle assets buying back shares of stock props up the value of these shares finally, buying back shares reduces the number of shares outstanding. The EPS is the firm's net earnings divided by number of shares so if the number of shares is smaller, the denominator in the division is smaller and the EPS is higher While equity analysts readily adjust for changes in the number of shares outstanding when they calculate EPS, this number tends not to be asterisked so everyone just goes along with the latest value. As the number of shares outstanding drops, everything else equal, the EPS must go up. So, it can be a misleading number. To use EPS as a multiplier, we start with the average price per share paid for an acquired firm. This purchase price is a marker that the markets use to price firms in a given industrial sector. Let's say, for example, that five firms were acquired in the last 3 years in the aviation parts sector. If the average price paid for these firms was 18x their average yearly EPS, that gives us something to work with in coming up with a price estimate for our own firm. For this example, we will assume that our firm's EPS for the last four quarters (trailing twelve months or TTM for short) of 4Q19 was $4.00. If we multiply the $4.00 by the 18x multiplier to EPS, we get that one estimate of the price per share of our firm, were it to be acquired at prices along the lines of those paid in the last 3 years, would be $72. The formula is as follows: Price per share = Average EPS Multiplier x 4Q19 EPS = 18 x $4.00 = $72.00 The above methodology works for the last four quarters, the next four quarters (4Q, which are the next twelve months or NTM) forecast, and the 4Q after that. So, conceivably, we can have multiple price per share estimates using one single EPS multiplier for our firm's forecast EPS for 2020 and 2021: Price per share= Average EPS Multiplier x 4Q20 EPS = 18 x $4.20 = $75.60 Price per share = Average EPS Multiplier x 4Q21 EPS = 18 x $4.50 = $81.00 As you can see, which year's EPS you use makes a big difference on price. Which one is chosen, as with beauty, depends on the observer. In general, the best option is to go with the TTM as it reflects actual results and not some forecast of dubious accuracy. After all, one does not want to overpay and the NTM and 4Q21 values show significant increases over 4Q19. Now that we have covered EPS, we can look at another metric that may be used to value a company's share price and that is Book Value (BV). The company's BV is the value of the equity in the balance sheet. Mind you, BV is not the market value of the equity (which is the number of shares outstanding times the market price per share), it is the value of the equity as represented by the sum of share paid-in capital plus retained earnings. The calculation for valuing a firm's share price using BV is very similar to the formula we used for EPS: Price per share = Average BV Multiplier x 4Q19 BV = 3.1 x $27.20 = $84.32 Something that you will notice when you work with multipliers is that they give different, sometimes wildly different, answers. These must be consolidated into a coherent number that will be applied to the firm. This consolidation requires that the multipliers be ranked in terms of reliability. For example, we already stated that EPS can be gamed (on the con side) but it's used constantly to show the firm's performance (on the pro side). With BV, it's an accounting figure that is used as the reference - the equity account in the balance sheet - so it is not strictly a figure that sheds much light on the firm's profitability, liquidity, or leverage, all of which are key for any firm One alternative is to use the Sales multiplier. The use of this multiplier is a bit more cumbersome that the two just discussed. This is because the value for our firm that we would get using the sales multiplier is the enterprise value (EV). Let's run an example with an average Sales multiplier of 2.1, TTM Sales of $3,750 Million and interest-bearing debt of $2,100 Million. The calculations are: EV = Average Sales Multiplier x 4019 Sales = 2.1 x $3750 = $7,875 Equity Value = EV - Debt = $7,875 - $2,100 = $5,775 If we assume that the firm has, say, 71 million shares outstanding, the price per share, based on the calculations above, is: $5,775 71 Price per share =- -= $81.34 Note that the division above works because the numerator and the denominator are both in millions. Had they not been, you would have to adjust the units for either one or both to make sure they are apples to apples. So, based on our Sales multiplier, the firm's share price should be around $81, which is not that different from the values obtained by the EPS and BV multipliers. As we noted with EPS and BV, these multipliers have flaws and while they are not fatal flaws, they are significant. The fact that they yield similar numbers should not distract the observer from these flaws. At this juncture, we reach into our financial metrics for the one true financial metric that any firm should rely on to give it an honest answer to how well it is performing. That metric is EBITDA - earnings before interest, taxes, depreciation, and amortization. The beauty of EBITDA is that it strips away all the externalities, as it were, that are contained in some financial metrics: the exclusion of interest eliminates the leveraging of the firm. Firms leverage to gain returns on equity. The problem with leverage is that as firms lever, they increase their risk to equity holders, so these raise their target ROE to account for that risk the exclusion of taxes eliminates the vagaries of changes to the tax code. These changes have nothing to do with the firm's efficiency and everything to do with political calculations at the national level, something that most firms should not rely on the exclusion of depreciation and amortization eliminates changes to accounting rules and tax laws that are meant to increase investment in capital goods. Policies that encourage investments in capital goods have nothing to do with a firm's efficiency and profitability and by excluding it, EBITDA provides the purest essence of the firm's operations As with the Sales multiplier, the value that one obtains using EBITDA is the firm's EV. So, as with Sales, we must run the same set of formulas. In this case, we will use the following assumptions - EBITDA multiplier = 10.6x, TTM EBITDA = $810 Million, interest-bearing debt = $2,100 Million, and shares outstanding = 71 Million: EV = Average EBITDA Multiplier x 4Q19 EBITDA = 10.6 x $810 = $8,586 Equity Value = EV - Debt = $8,586 - $2,100 = $6,486 $6,486 71 Price per share= The EBITDA calculation shows a higher price per share for the firm than the other three multipliers do. This leaves in a bit of a quandary. Which of the multipliers should be overweighed, if at all? Which ones should be underweighed, if at all? Should all be weighed equally? Should some multipliers be excluded? $91.35 To analyze this situation, perhaps the starting point should be to show all four per share prices side by side and compare them. We do this below: Multiplier EPS Book Value Sales EBITDA Calculated $ per share $72.00 $84.32 $81.34 $91.35 Index to EPS 100% 117% 113% 127% We can take the data above and make some assumptions on how we will weigh the values per share. Before we do, though, we introduce two new factors that are not multipliers per se but still provide value in the calculations. Transactions The first is premium paid over pre-announcement share price. This figure is fairly easy to calculate. The share price of the acquired firm trades at what is considered an equilibrium price (that is, the equilibrium between demand for the stock by investors and supply of the stock by sellers). That share price is compared to the final price paid once the acquisition was finalized. This premium percent is then applied to the current share price of our firm to come up with what its purchase price might be: Price per share = Pre-announcement share price x (1 + Premium) Assuming a pre-announcement share price of, say $71.00 and a premium paid of 21% over the pre-announcement price, we get: Price per share = $71.00 x (1 +21%) = $85.91 The second factor we can bring in is synergies. Synergies are a catch-all term for scale benefits that the two combined firms can obtain that could not be obtained had the two been operating independently. So, synergies are a significant factor in the price premium paid because they assume that the acquired firm is more valuable once it has been combined with the acquiring firm, thus yielding economies of scale. Synergies are only relevant and should only be included in the calculations if and only if the acquiring firm will adjust its budgets to include these forecast savings. Many firms do not do this and as a result, the synergies that were forecast do not pan out. Still, hope springs eternal and firms pay over the trading value for a firm. Synergy-related share prices use the same formula as the price premium paid over the pre- announcement share price: Price per share = $71.00 x (1 +18%) = $81.65 One example of synergies is the projected salary savings from redundant staff. When two firms merge (or when one is acquired), there will likely be areas where staff are redundant. For example, the various departments of the two firms combined have a total staff of, say, one thousand. In the combined firm, only 650 staff may be needed. This means that 350 staff are redundant. (It is cruel to consider this perhaps, but it is a calculation that is made during mergers and acquisitions so we must understand the mechanics of it.) Some firms do make staff redundant and cut jobs after an acquisition or a merger in order to collect these synergies. Let's do the math with the 350 staff cuts. For this example, let's assume the following: average staff salary = $65,000, average cost of benefits = 30% of salary, yearly salary growth rate = 3%, WACC = 7%, shares outstanding = 71 million: Perpetuity Value of Staff Cuts : 350 x $65,000 x (1+.30%) (7% -3%) $739,375,000 71,000,000 = $739,375,000 Perpetuity Value per share= Just the estimated staffing cuts are estimated to provide $10.41 per share in gains to the combined firm. This compares well with the premium dollar paid over pre-announcement of $10.65 ($81.65 minus $71). $10.41 So, when you read about mergers and acquisitions and the job cuts that follow, what you are actually reading is the implementation of synergy projections that informed the final price paid for the acquired firm. As we said, this is a cruel concept in business but it is a calculation that is made all the time during mergers and acquisitions. In fact, it is very likely that one of the key drivers in mergers and acquisitions is the gain of synergies (read scale) to the acquiring firm. The reality, though, is a bit messier. Too often, and this has been explained extensively in the press, the culture of the acquiring firm clashes with the culture of the acquired firm to create a less than optimal combination. One example of this is the merger between McDonnell-Douglas and Boeing in 1997. To many in Boeing, the philosophy of McDonnell-Douglas executives did not mesh well with the philosophy of Boeing as a whole. Continuing with our example, we can now put the complete table of values for the multipliers, including the stock premium and synergy values: Multiplier EPS Book Value Sales EBITDA Premium Synergy Price/share $72.00 $84.32 $81.34 $91.35 $85.91 $81.65 Weight 10% 10% 10% 50% Present Value le= 10% 10% 100% Interestingly, the $86.20 weighed average share price we just calculated is 21% above the $71.00 pre-announcement share price. This is the same number as the premium paid by other firms that acquired firms in past years. Dividend Discount Model (DDM) The DDM mimics the methodology used by the free cash flow (FCF) valuation but instead of calculating the income statement, balance sheet, and FCF, it just uses the dividends paid out by the firm as a proxy for the cash flows. $2.30 x (1 + 0.4) (1+.07) Weighed Price/share $7.20 $8.43 While this makes quick work of the valuation, it is of course a very rough estimate of what the price per share should be for our firm. To calculate the share price using the DDM, we start with the firm's last yearly dividend payments - in other words, we use the TTM dividend stream paid by the firm. The formula for the present value of the dividend stream is as follows: $2.30 x (1 +.04) (1+.07) $2.30 x (1+.04)* (.07 - .04) Let's say that for the purposes of our calculation, the firm has the following values: dividends paid out TTM (2019) = $2.30 projected yearly growth in dividend payments = 4.0% WACC for the firm = 7.0% $8.13 $45.68 $8.59 $8.17 $86.20 + = - $82.85 The DDM model gives an answer that is lower than what we calculated using the various weighed multipliers but still not far off. Still, it's an estimate of what the actual value of the firm's stock price is and a very rough one at that. The reason why it's such a rough estimate is that dividends are not a reliable proxy for FCF. Some firms pay more in dividends than they should and some pay no dividends when they should. In the first case, firms pay too much in dividends because in the past they performed well and paid solid dividends but the present doesn't offer such halcyon times. So, while they should reduce their dividend payouts and keep cash in the firm for internal projects and overall liquidity, they pay dividends in order not to trigger the wrath of shareholders, who would sell their shares and crater the stock price. In the second case, some companies don't pay dividends (think tech here) and won't pay them because they haven't done so in the past. So, their cash balances build up to very high levels until they become rather untenable (remember the cost of funding those cash balances is the WACC and the cash balances are earning paltry retums compared to the firm's WACC). When these become untenable, some firms make special dividend payouts to shareholders. One example of a special dividend is Costco's $10/share special dividend paid out in December, 2020. This compares with an annual average divided paid out of $2.80/share. Case Questions Use the template provided to: calculate share price estimates using EPS, Sales, BV, EBITDA, premiums, and synergies apply the weights used in this document to the six factors above to come up with a weighed price per share use the dividend payments and projected growth rates provided to calculate the DDM- based prices per share for three firms The template contains all the data you need to complete the assignment. Historical Multiples: - Average Equity Valuations using Multiples and Transactions Sales EBITDA Premium Synergy BV EPS Book Value Average Average JTM EPS Average JTM Book Value Average EBITDA JTM EBITDA (Last 4Q) Firm Value Debt Value Equity Value Average Sales JTM Sales (Last 4Q) Firm Value Debt Value Equity Value Average Premium Pre-Announcement Stock Price Synergy Pre-Announcement Stock Price EPS 17.0 Last 40 4.00 68.00 3.0 Est. 2021 4.15 70.55 22.50 67.50 2.0 Est. 2022 4.33 73.61 3,722 1,800 10.0 744 1,800 35.0% 45.00 15.75 25.0% 45.00 0.25 Shares outstanding (M) 68.50 When firms do not have the time, staffing, expertise, or the inclination to calculate their price per share, they use shortcuts to estimate this number. These shortcuts can be summarized using the following: Multipliers (EPS, Sales, Book Value, EBITDA) Transactions (premium, synergy) Dividend discount model (DDM) In this document, we will go over each of these in detail and weigh the pros and cons of each. Multipliers This methodology looks at the prices paid for firms in the same industry and relates the prices paid to different metrics for the firm. One example of this is earnings per share (EPS). EPS is one of the favorite metrics used by firm managers and equity analysts to summarize a firm's financial performance. The problem with EPS is that it can be gamed. For example, something that corporations have been doing for quite a few years is to take excess cash and buy back shares of stock. In doing this they accomplish the following: they reduce cash balances which, in the event of an acquisition, represent a discount to the buyer; no one wants to sell anything at a discount! high cash balances are a drag on performance because the firm's weighed average cost of capital (WACC) must fund these balances. Cash accounts, in general, earn little to no interest while the WACC's value is much higher. So, in net terms, the firm is funding basically idle assets buying back shares of stock props up the value of these shares finally, buying back shares reduces the number of shares outstanding. The EPS is the firm's net earnings divided by number of shares so if the number of shares is smaller, the denominator in the division is smaller and the EPS is higher While equity analysts readily adjust for changes in the number of shares outstanding when they calculate EPS, this number tends not to be asterisked so everyone just goes along with the latest value. As the number of shares outstanding drops, everything else equal, the EPS must go up. So, it can be a misleading number. To use EPS as a multiplier, we start with the average price per share paid for an acquired firm. This purchase price is a marker that the markets use to price firms in a given industrial sector. Let's say, for example, that five firms were acquired in the last 3 years in the aviation parts sector. If the average price paid for these firms was 18x their average yearly EPS, that gives us something to work with in coming up with a price estimate for our own firm. For this example, we will assume that our firm's EPS for the last four quarters (trailing twelve months or TTM for short) of 4Q19 was $4.00. If we multiply the $4.00 by the 18x multiplier to EPS, we get that one estimate of the price per share of our firm, were it to be acquired at prices along the lines of those paid in the last 3 years, would be $72. The formula is as follows: Price per share = Average EPS Multiplier x 4Q19 EPS = 18 x $4.00 = $72.00 The above methodology works for the last four quarters, the next four quarters (4Q, which are the next twelve months or NTM) forecast, and the 4Q after that. So, conceivably, we can have multiple price per share estimates using one single EPS multiplier for our firm's forecast EPS for 2020 and 2021: Price per share= Average EPS Multiplier x 4Q20 EPS = 18 x $4.20 = $75.60 Price per share = Average EPS Multiplier x 4Q21 EPS = 18 x $4.50 = $81.00 As you can see, which year's EPS you use makes a big difference on price. Which one is chosen, as with beauty, depends on the observer. In general, the best option is to go with the TTM as it reflects actual results and not some forecast of dubious accuracy. After all, one does not want to overpay and the NTM and 4Q21 values show significant increases over 4Q19. Now that we have covered EPS, we can look at another metric that may be used to value a company's share price and that is Book Value (BV). The company's BV is the value of the equity in the balance sheet. Mind you, BV is not the market value of the equity (which is the number of shares outstanding times the market price per share), it is the value of the equity as represented by the sum of share paid-in capital plus retained earnings. The calculation for valuing a firm's share price using BV is very similar to the formula we used for EPS: Price per share = Average BV Multiplier x 4Q19 BV = 3.1 x $27.20 = $84.32 Something that you will notice when you work with multipliers is that they give different, sometimes wildly different, answers. These must be consolidated into a coherent number that will be applied to the firm. This consolidation requires that the multipliers be ranked in terms of reliability. For example, we already stated that EPS can be gamed (on the con side) but it's used constantly to show the firm's performance (on the pro side). With BV, it's an accounting figure that is used as the reference - the equity account in the balance sheet - so it is not strictly a figure that sheds much light on the firm's profitability, liquidity, or leverage, all of which are key for any firm One alternative is to use the Sales multiplier. The use of this multiplier is a bit more cumbersome that the two just discussed. This is because the value for our firm that we would get using the sales multiplier is the enterprise value (EV). Let's run an example with an average Sales multiplier of 2.1, TTM Sales of $3,750 Million and interest-bearing debt of $2,100 Million. The calculations are: EV = Average Sales Multiplier x 4019 Sales = 2.1 x $3750 = $7,875 Equity Value = EV - Debt = $7,875 - $2,100 = $5,775 If we assume that the firm has, say, 71 million shares outstanding, the price per share, based on the calculations above, is: $5,775 71 Price per share =- -= $81.34 Note that the division above works because the numerator and the denominator are both in millions. Had they not been, you would have to adjust the units for either one or both to make sure they are apples to apples. So, based on our Sales multiplier, the firm's share price should be around $81, which is not that different from the values obtained by the EPS and BV multipliers. As we noted with EPS and BV, these multipliers have flaws and while they are not fatal flaws, they are significant. The fact that they yield similar numbers should not distract the observer from these flaws. At this juncture, we reach into our financial metrics for the one true financial metric that any firm should rely on to give it an honest answer to how well it is performing. That metric is EBITDA - earnings before interest, taxes, depreciation, and amortization. The beauty of EBITDA is that it strips away all the externalities, as it were, that are contained in some financial metrics: the exclusion of interest eliminates the leveraging of the firm. Firms leverage to gain returns on equity. The problem with leverage is that as firms lever, they increase their risk to equity holders, so these raise their target ROE to account for that risk the exclusion of taxes eliminates the vagaries of changes to the tax code. These changes have nothing to do with the firm's efficiency and everything to do with political calculations at the national level, something that most firms should not rely on the exclusion of depreciation and amortization eliminates changes to accounting rules and tax laws that are meant to increase investment in capital goods. Policies that encourage investments in capital goods have nothing to do with a firm's efficiency and profitability and by excluding it, EBITDA provides the purest essence of the firm's operations As with the Sales multiplier, the value that one obtains using EBITDA is the firm's EV. So, as with Sales, we must run the same set of formulas. In this case, we will use the following assumptions - EBITDA multiplier = 10.6x, TTM EBITDA = $810 Million, interest-bearing debt = $2,100 Million, and shares outstanding = 71 Million: EV = Average EBITDA Multiplier x 4Q19 EBITDA = 10.6 x $810 = $8,586 Equity Value = EV - Debt = $8,586 - $2,100 = $6,486 $6,486 71 Price per share= The EBITDA calculation shows a higher price per share for the firm than the other three multipliers do. This leaves in a bit of a quandary. Which of the multipliers should be overweighed, if at all? Which ones should be underweighed, if at all? Should all be weighed equally? Should some multipliers be excluded? $91.35 To analyze this situation, perhaps the starting point should be to show all four per share prices side by side and compare them. We do this below: Multiplier EPS Book Value Sales EBITDA Calculated $ per share $72.00 $84.32 $81.34 $91.35 Index to EPS 100% 117% 113% 127% We can take the data above and make some assumptions on how we will weigh the values per share. Before we do, though, we introduce two new factors that are not multipliers per se but still provide value in the calculations. Transactions The first is premium paid over pre-announcement share price. This figure is fairly easy to calculate. The share price of the acquired firm trades at what is considered an equilibrium price (that is, the equilibrium between demand for the stock by investors and supply of the stock by sellers). That share price is compared to the final price paid once the acquisition was finalized. This premium percent is then applied to the current share price of our firm to come up with what its purchase price might be: Price per share = Pre-announcement share price x (1 + Premium) Assuming a pre-announcement share price of, say $71.00 and a premium paid of 21% over the pre-announcement price, we get: Price per share = $71.00 x (1 +21%) = $85.91 The second factor we can bring in is synergies. Synergies are a catch-all term for scale benefits that the two combined firms can obtain that could not be obtained had the two been operating independently. So, synergies are a significant factor in the price premium paid because they assume that the acquired firm is more valuable once it has been combined with the acquiring firm, thus yielding economies of scale. Synergies are only relevant and should only be included in the calculations if and only if the acquiring firm will adjust its budgets to include these forecast savings. Many firms do not do this and as a result, the synergies that were forecast do not pan out. Still, hope springs eternal and firms pay over the trading value for a firm. Synergy-related share prices use the same formula as the price premium paid over the pre- announcement share price: Price per share = $71.00 x (1 +18%) = $81.65 One example of synergies is the projected salary savings from redundant staff. When two firms merge (or when one is acquired), there will likely be areas where staff are redundant. For example, the various departments of the two firms combined have a total staff of, say, one thousand. In the combined firm, only 650 staff may be needed. This means that 350 staff are redundant. (It is cruel to consider this perhaps, but it is a calculation that is made during mergers and acquisitions so we must understand the mechanics of it.) Some firms do make staff redundant and cut jobs after an acquisition or a merger in order to collect these synergies. Let's do the math with the 350 staff cuts. For this example, let's assume the following: average staff salary = $65,000, average cost of benefits = 30% of salary, yearly salary growth rate = 3%, WACC = 7%, shares outstanding = 71 million: Perpetuity Value of Staff Cuts : 350 x $65,000 x (1+.30%) (7% -3%) $739,375,000 71,000,000 = $739,375,000 Perpetuity Value per share= Just the estimated staffing cuts are estimated to provide $10.41 per share in gains to the combined firm. This compares well with the premium dollar paid over pre-announcement of $10.65 ($81.65 minus $71). $10.41 So, when you read about mergers and acquisitions and the job cuts that follow, what you are actually reading is the implementation of synergy projections that informed the final price paid for the acquired firm. As we said, this is a cruel concept in business but it is a calculation that is made all the time during mergers and acquisitions. In fact, it is very likely that one of the key drivers in mergers and acquisitions is the gain of synergies (read scale) to the acquiring firm. The reality, though, is a bit messier. Too often, and this has been explained extensively in the press, the culture of the acquiring firm clashes with the culture of the acquired firm to create a less than optimal combination. One example of this is the merger between McDonnell-Douglas and Boeing in 1997. To many in Boeing, the philosophy of McDonnell-Douglas executives did not mesh well with the philosophy of Boeing as a whole. Continuing with our example, we can now put the complete table of values for the multipliers, including the stock premium and synergy values: Multiplier EPS Book Value Sales EBITDA Premium Synergy Price/share $72.00 $84.32 $81.34 $91.35 $85.91 $81.65 Weight 10% 10% 10% 50% Present Value le= 10% 10% 100% Interestingly, the $86.20 weighed average share price we just calculated is 21% above the $71.00 pre-announcement share price. This is the same number as the premium paid by other firms that acquired firms in past years. Dividend Discount Model (DDM) The DDM mimics the methodology used by the free cash flow (FCF) valuation but instead of calculating the income statement, balance sheet, and FCF, it just uses the dividends paid out by the firm as a proxy for the cash flows. $2.30 x (1 + 0.4) (1+.07) Weighed Price/share $7.20 $8.43 While this makes quick work of the valuation, it is of course a very rough estimate of what the price per share should be for our firm. To calculate the share price using the DDM, we start with the firm's last yearly dividend payments - in other words, we use the TTM dividend stream paid by the firm. The formula for the present value of the dividend stream is as follows: $2.30 x (1 +.04) (1+.07) $2.30 x (1+.04)* (.07 - .04) Let's say that for the purposes of our calculation, the firm has the following values: dividends paid out TTM (2019) = $2.30 projected yearly growth in dividend payments = 4.0% WACC for the firm = 7.0% $8.13 $45.68 $8.59 $8.17 $86.20 + = - $82.85 The DDM model gives an answer that is lower than what we calculated using the various weighed multipliers but still not far off. Still, it's an estimate of what the actual value of the firm's stock price is and a very rough one at that. The reason why it's such a rough estimate is that dividends are not a reliable proxy for FCF. Some firms pay more in dividends than they should and some pay no dividends when they should. In the first case, firms pay too much in dividends because in the past they performed well and paid solid dividends but the present doesn't offer such halcyon times. So, while they should reduce their dividend payouts and keep cash in the firm for internal projects and overall liquidity, they pay dividends in order not to trigger the wrath of shareholders, who would sell their shares and crater the stock price. In the second case, some companies don't pay dividends (think tech here) and won't pay them because they haven't done so in the past. So, their cash balances build up to very high levels until they become rather untenable (remember the cost of funding those cash balances is the WACC and the cash balances are earning paltry retums compared to the firm's WACC). When these become untenable, some firms make special dividend payouts to shareholders. One example of a special dividend is Costco's $10/share special dividend paid out in December, 2020. This compares with an annual average divided paid out of $2.80/share. Case Questions Use the template provided to: calculate share price estimates using EPS, Sales, BV, EBITDA, premiums, and synergies apply the weights used in this document to the six factors above to come up with a weighed price per share use the dividend payments and projected growth rates provided to calculate the DDM- based prices per share for three firms The template contains all the data you need to complete the assignment


