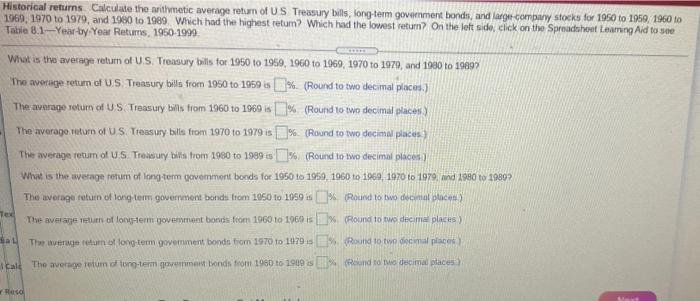
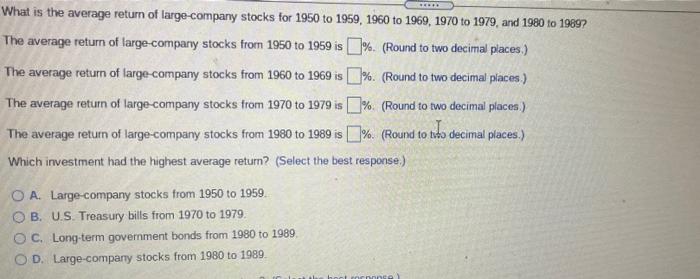
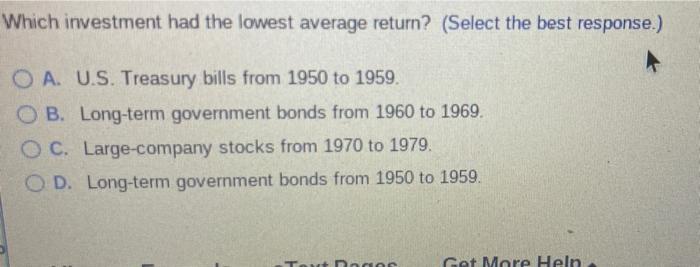
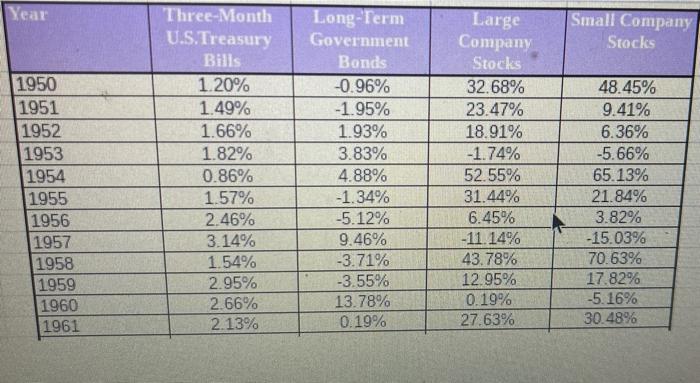
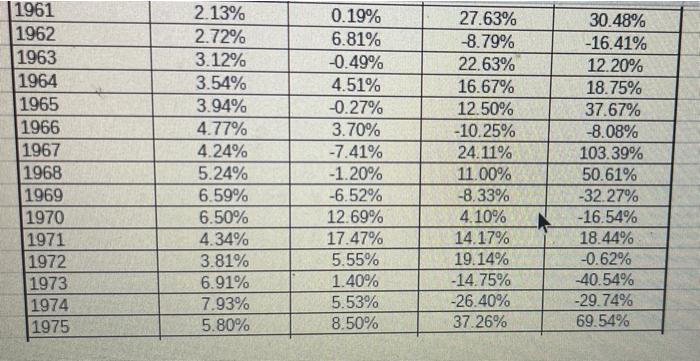
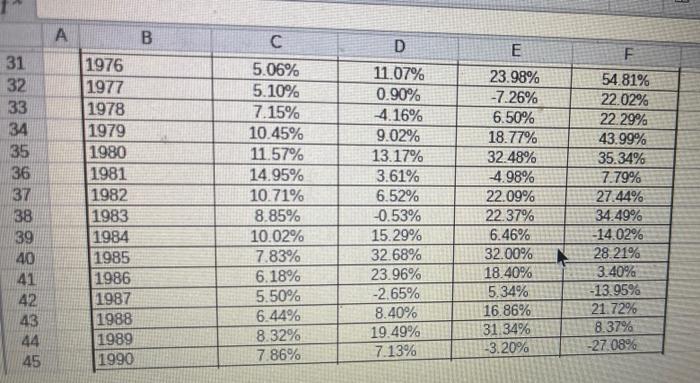
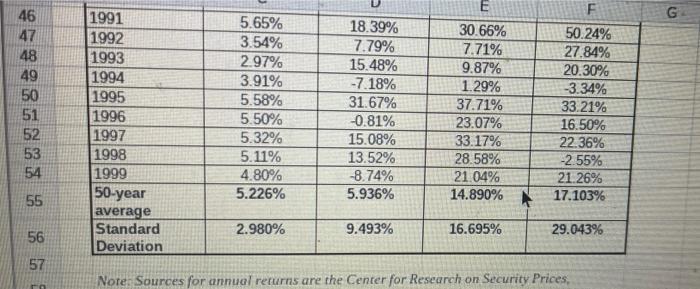
Historical returns Calculate the arithmetic average return of US Treasury bills, long-term government bonds, and large comowy stocks for 1950 to 1959, 1960 to 1969 1970 to 1979, and 1980 to 1989 Which had the highest retum? Which had the lowest retum? On the left side click on the Spreadshot Laming Aid to see Table 8.1-Year-by Year Retums, 1960-1999 What is the average return of US Treasury bills for 1950 to 1959, 1960 to 1969, 1970 to 1979, and 1990 to 1989 The average return of US Treasury bills from 1950 to 1959 is %. (Round to two decimal places) The average return of U.S. Treasury bills from 1960 to 1969 is % (Round to two decimal places) The average return of US Treasury bills from 1970 to 1979 is % (Round to two decimal places The werage return of US Treasury bills from 1980 to 1989 is % (Round to two decimal places What is the average return of long-term goverment bonds for 1950 to 1959 1960 to 1969, 1970 to 1979 and 1990 to 19802 The average return of long term government bonds from 1950 to 1959 10% Round to two decat cea) The average return of long-term government bonds from 1960 10 1969 15 % Round to two decime places) The average return of long-term government bonds from 1970 to 1970 is Round to two deemal piane) cal The average retumo tong-term government bonds from 1980 to 1909 3% Rekend to decima slaces Tee dia Hasd What is the average return of large-company stocks for 1950 to 1959, 1960 to 1969, 1970 to 1979, and 1980 to 1989? The average return of large-company stocks from 1950 to 1959 is 1%. (Round to two decimal places) The average return of large-company stocks from 1960 to 1969 is %. (Round to two decimal places) The average return of large-company stocks from 1970 to 1979 is % (Round to two decimal places.) The average return of large-company stocks from 1980 to 1989 is 5%. (Round to toho decimal places.) Which investment had the highest average return? (Select the best response.) O A. Large-company stocks from 1950 1959. OB.U.S. Treasury bills from 1970 to 1979. O C. Long-term government bonds from 1980 to 1989 OD. Large-company stocks from 1980 to 1989 ornance Which investment had the lowest average return? (Select the best response.) OA. U.S. Treasury bills from 1950 to 1959. O B. Long-term government bonds from 1960 to 1969. O C. Large-company stocks from 1970 to 1979. OD. Long-term government bonds from 1950 to 1959. TA Get More Heln Year Small Company Stocks 1950 1951 1952 1953 1954 1955 1956 1957 1958 1959 1960 1961 Three-Month U.S.Treasury Bills 1.20% 1.49% 1.66% 1.82% 0.86% 1.57% 2.46% 3.14% 1.54% 2.95% 2.66% 2.13% Long-Term Government Bonds -0.96% -1.95% 1.93% 3.83% 4.88% -1.34% -5.12% 9.46% -3.71% -3.55% 13.78% 0.19% Large Company Stocks 32.68% 23.47% 18.91% -1.74% 52.55% 31.44% 6.45% -11.14% 43.78% 12.95% 0.19% 27.63% 48.45% 9.41% 6.36% -5.66% 65.13% 21.84% 3.82% -15.03% 70.63% 17.82% -5.16% 30.48% | 1961 1962 1963 1964 1965 1966 1967 1968 1969 1970 1971 1972 1973 1974 1975 2.13% 2.72% 3.12% 3.54% 3.94% 4.77% 4.24% 5.24% 6.59% 6.50% 4.34% 3.81% 6.91% 7.93% 5.80% 0.19% 6.81% -0.49% 4.51% -0.27% 3.70% -7.41% -1.20% -6.52% 12.69% 17.47% 5.55% 1.40% 5.53% 8.50% 27.63% -8.79% 22.63% 16.67% 12.50% -10.25% 24.11% 11.00% -8.33% 4.10% 14.17% 19.14% -14.75% -26.40% 37.26% 30.48% -16.41% 12.20% 18.75% 37.67% -8.08% 103.39% 50.61% -32.27% -16.54% 18.44% -0.62% -40.54% -29.74% 69.54% 31 32 33 34 35 36 37 A B 1976 1977 1978 1979 1980 1981 1982 1983 1984 1985 1986 1987 1988 1989 1990 5.06% 5.10% 7.15% 10.45% 11.57% 14.95% 10.71% 8.85% 10.02% 7.83% 6.18% 5.50% 6.44% 8.32% 7.86% D 11.07% 0.90% 4.16% 9.02% 13.17% 3.61% 6.52% -0.53% 15.29% 32.68% 23.96% -2.65% 8.40% 19.49% 7.13% E 23.98% -7.26% 6.50% 18.77% 32.48% 4.98% 22.09% 22.37% 6.46% 32.00% 18.40% 5.34% 16.86% 31.34% -3.20% F 54.81% 22.02% 22.29% 43.99% 35.34% 7.79% 27.44% 34.49% -14.02% 28.21% 3.40% -13.95% 21.72% 8.37% -27.08% 38 39 40 41 42 43 44 45 G 46 47 48 49 50 51 52 53 54 1991 1992 1993 1994 1995 1996 1997 1998 1999 50-year average Standard Deviation 5.65% 3.54% 2.97% 3.91% 5.58% 5.50% 5.32% 5.11% 4.80% 5.226% 18.39% 7.79% 15.48% -7.18% 31.67% -0.81% 15.08% 13.52% -8.74% 5.936% 30.66% 50.24% 7.71% 27.84% 9.87% 20.30% 1.29% -3.34% 37.71% 33.21% 23.07% 16.50% 33.17% 22.36% 28.58% -2.55% 21.04% 21.26% 14.890% 17.103% 55 2.980% 9.493% 16.695% 29.043% 56 57 Note: Sources for annual returns are the Center for Research on Security Prices, ra
