Question
Historically, the average time a customer spent queuing for a teller at a particular bank was 140 seconds. To determine whether the average time had
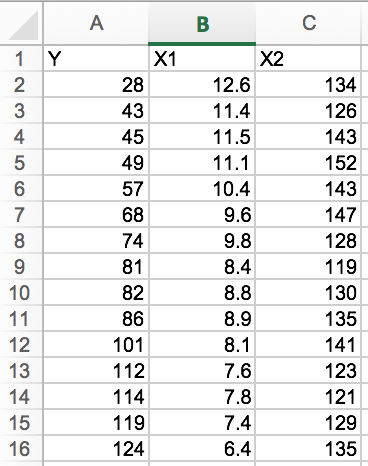
Historically, the average time a customer spent queuing for a teller at a particular bank was 140 seconds. To determine whether the average time had improved since they changed the staff manager, the bank took a random sample of 15 customers and recorded their waiting time (in seconds). The results are in the X2 column of the data file P14.12.xlswhich can be found in a folder underthe CML Quizzes tab.
Assume that the test is performed at the 5% level of significance and that the distribution of waiting times is approximately normally distributed.
1. State the direction of the alternative hypothesis used to test whether average waiting time had improved. Type gt (greater than),ge(greater than or equal to),lt(less than),le(less than or equal to) orne(not equal to) as appropriate in the box.
2. Calculate the test statistic correct to three decimal places (hint: use Descriptive Statistics to calculated the standard deviation and sample mean).
3. UseKaddStatto determine the p-value for the test correct to four decimal places.
4. Is the null hypothesis rejected for this test? Type yes or no.
5. Regardless of your answer for 4, if the null hypothesis was rejected, could we conclude that the average time is more than 140 seconds at the 5% level of significance? Type yes or no.

Step by Step Solution
There are 3 Steps involved in it
Step: 1

Get Instant Access to Expert-Tailored Solutions
See step-by-step solutions with expert insights and AI powered tools for academic success
Step: 2

Step: 3

Ace Your Homework with AI
Get the answers you need in no time with our AI-driven, step-by-step assistance
Get Started


