Answered step by step
Verified Expert Solution
Question
1 Approved Answer
Home Depot-Fiscal 2022 Pg. 10 CAUTION Do NOT do a Cut operation on any cell in the project. Liquidity Indicators Use the information in
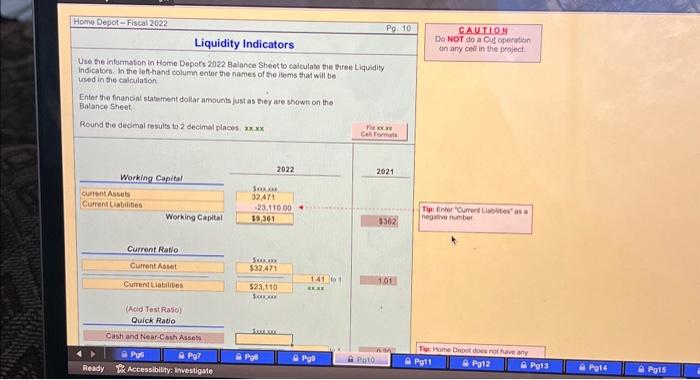
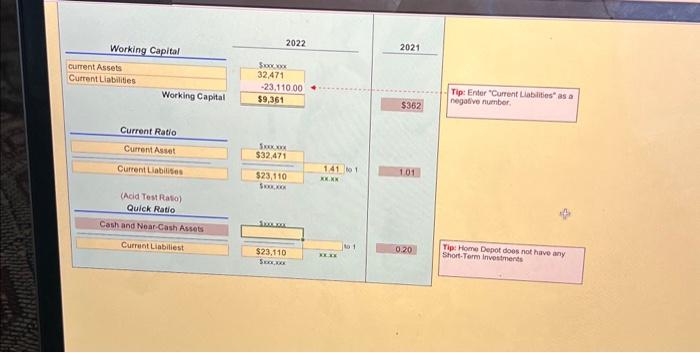
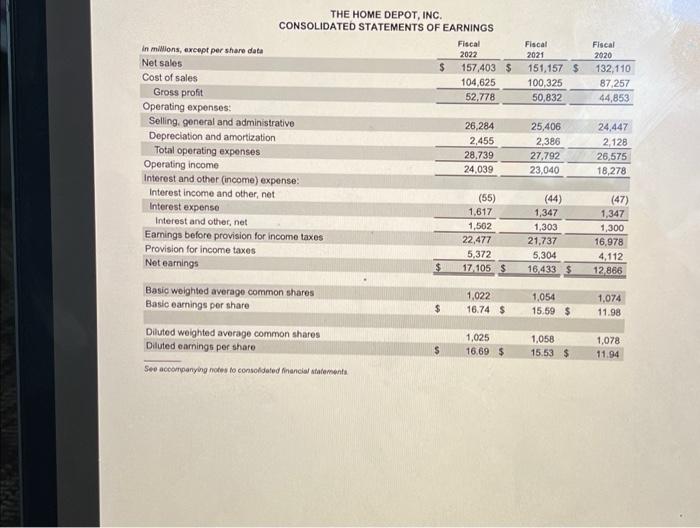
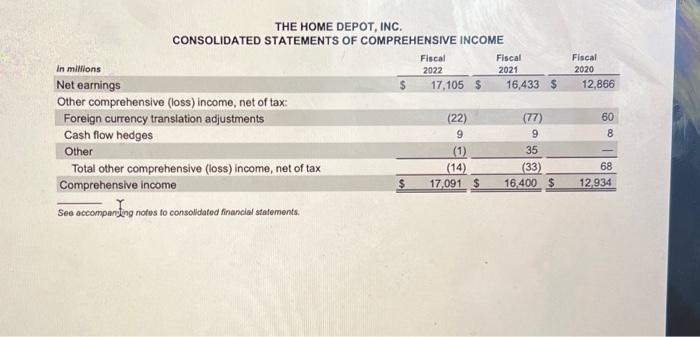
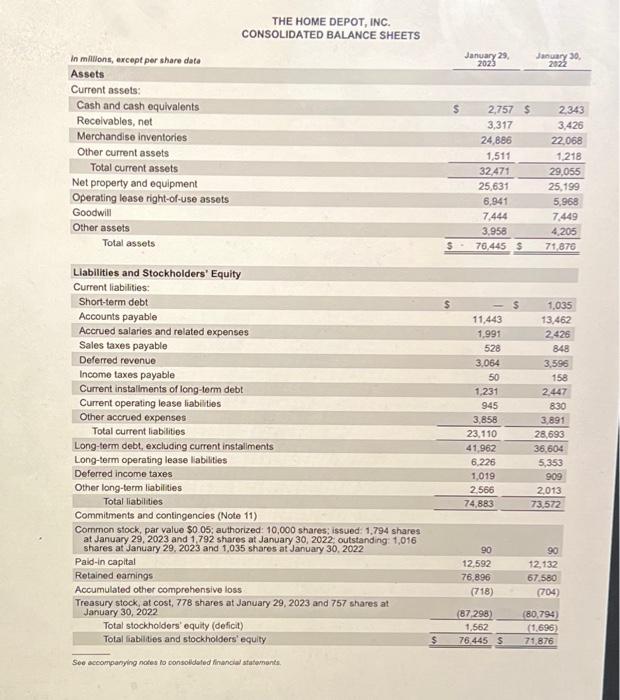
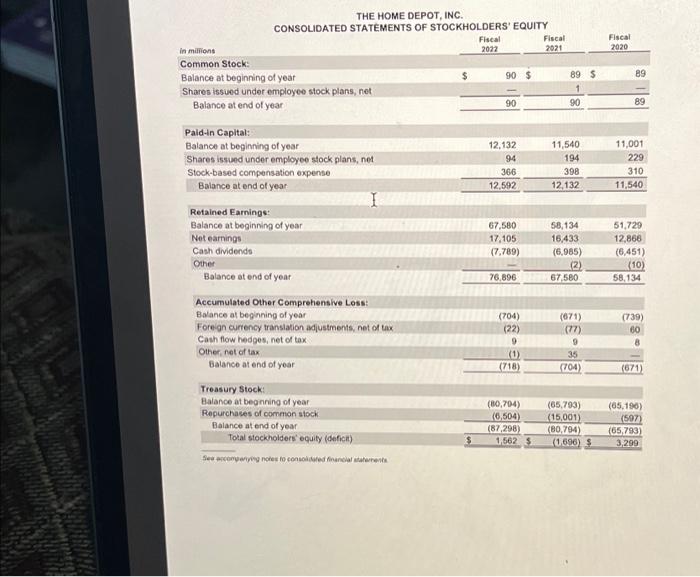
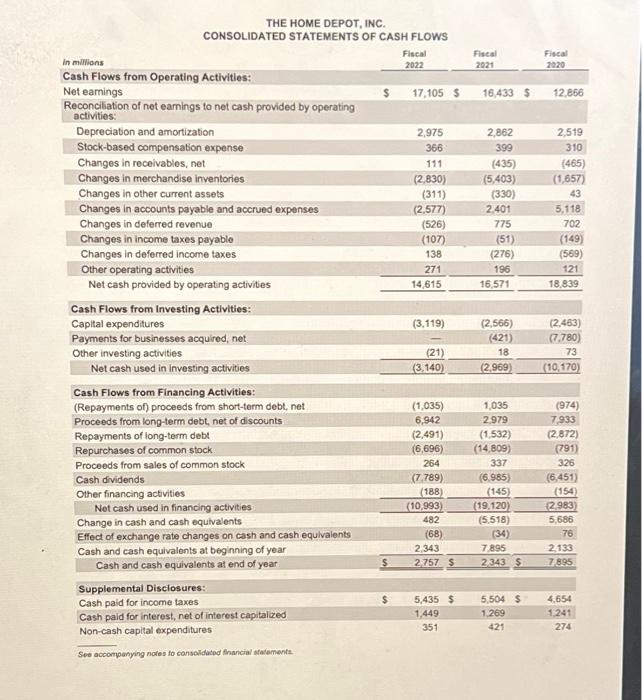
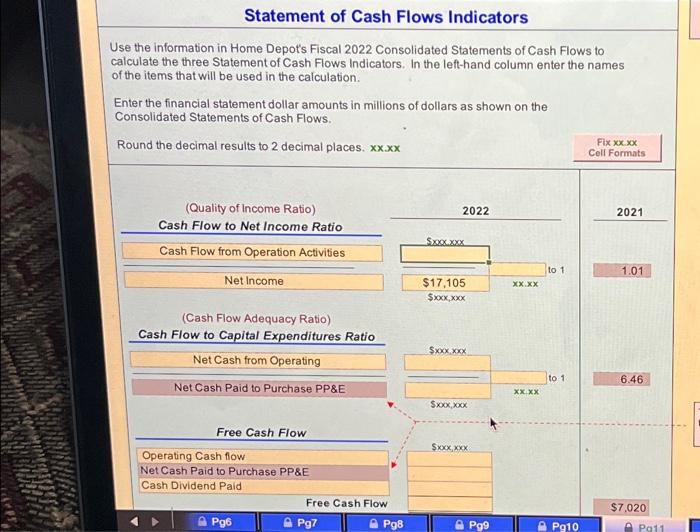
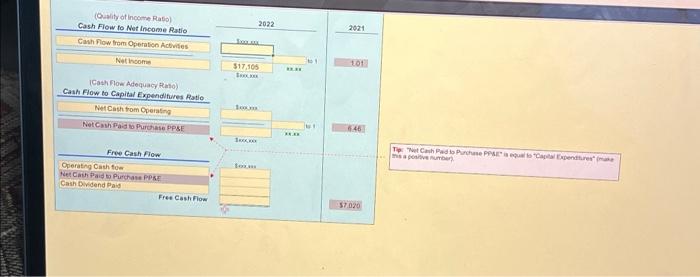
Home Depot-Fiscal 2022 Pg. 10 CAUTION Do NOT do a Cut operation on any cell in the project. Liquidity Indicators Use the information in Home Depot's 2022 Balance Sheet to calculate the three Liquidity Indicators. In the left-hand column enter the names of the items that will be used in the calculation. Enter the financial statement dollar amounts just as they are shown on the Balance Sheet Round the decimal results to 2 decimal places, xx.xx Cell Formats 2022 2021 Working Capital Current Assets 32471 Current Liabilites -23.110.00 Working Capital $9,361 Tip: Enter "Current Liabilities as a negative number $362 Current Ratio Current Asset $32,471 141 1 101 Current Liabilities $23,110 (Acid Test Raso) Quick Ratio Cash and Near-Cash Assets Pys Tip: Home Depot does not have any Pg7 PgB PgB Pato Pg11 Pg12 Pg13 Pg14 Pg15 Ready Accessibility: Investigate 2022 2021 Working Capital $xxxxxxx current Assets 32,471 Current Liabilities -23.110.00 Working Capital $9,361 $362 Current Ratio Sxxxxx Current Asset $32.471 141 to 1 1.01 Current Liabilises $23,110 XX.XX (Acid Test Ratio) Quick Ratio Cash and Near-Cash Assets to 1 0.20 Current Liabiliest $23,110 XLXX SAXX.XXX Tip: Enter "Current Liabilities" as a negative number, Tip: Home Depot does not have any Short-Term Investments in millions, except per share data Net sales Cost of sales Gross profit Operating expenses: THE HOME DEPOT, INC. CONSOLIDATED STATEMENTS OF EARNINGS Selling, general and administrative Depreciation and amortization Fiscal 2022 Fiscal 2021 Fiscal 2020 $ 157,403 151,157 $ 132,110 104,625 100,325 87,257 52,778 50,832 44,853 26,284 25,406 24,447 2,455 2,386 2,128 Total operating expenses 28,739 27,792 26,575 Operating income 24,039 23,040 18,278 Interest and other (income) expense: 1 Interest income and other, net (55) (44) (47) Interest expense Interest and other, net 1,617 1,347 1,347 1,502 1,303 1,300 Earnings before provision for income taxes 22,477 21,737 16,978 Provision for income taxes 5,372 5,304 4,112 Net earnings $ 17.105 $ 16,433 $ 12,866 Basic weighted average common shares 1,022 1,054 1,074 Basic earnings per share $ 16.74 $ 15.59 $ 11.98 Diluted weighted average common shares 1,025 1,058 1,078 Diluted earnings per share $ 16.69 $ 15.53 $ 11.94 See accompanying notes to consolidated financial statements THE HOME DEPOT, INC. CONSOLIDATED STATEMENTS OF COMPREHENSIVE INCOME Fiscal Fiscal in millions 2022 2021 Fiscal 20201 Net earnings Other comprehensive (loss) income, net of tax: Foreign currency translation adjustments $ 17,105 $ 16,433 $ 12,866 (22) (77) 60 Cash flow hedges 9 9 8 Other (1) 35 Total other comprehensive (loss) income, net of tax Comprehensive income (14) (33) 68 $ 17,091 $ 16,400 $ 12,934 See accompanying notes to consolidated financial statements. in millions, except per share data Assets Current assets: Cash and cash equivalents Receivables, net Merchandise inventories Other current assets Total current assets Net property and equipment Operating lease right-of-use assets Goodwill Other assets Total assets Liabilities and Stockholders' Equity Current liabilities: Short-term debt THE HOME DEPOT, INC. CONSOLIDATED BALANCE SHEETS January 29, 2023 January 30, 2022 2,757 $ 2,343 3,317 3,426 24,886 22,068 1,511 1,218 32,471 29,055 25,631 25,199 6,941 5,968 7,444 7,449 3,958 4,205 $ - 76,445 $ 71,876 1,035 Accounts payable 11,443 13,462 Accrued salaries and related expenses 1,991 2,426 Sales taxes payable 528 848 Deferred revenue 3,064 3,596 Income taxes payable 50 158 Current installments of long-term debt Current operating lease liabilities Other accrued expenses Total current liabilities Long-term debt, excluding current installments Long-term operating lease liabilities Deferred income taxes 1,231 2,447 945 830 3,858 3,891 23,110 28,693 41,962 36,604 6,226 5,353 1,019 909 Other long-term liabilities 2,566 2,013 Total liabilities 74,883 73,572 Commitments and contingencies (Note 11) Common stock, par value $0.05; authorized: 10,000 shares; issued: 1,794 shares at January 29, 2023 and 1,792 shares at January 30, 2022, outstanding: 1,016 shares at January 29, 2023 and 1,035 shares at January 30, 2022 90 Paid-in capital 12,592 90 12,132 Retained earnings 76,896 67.580 Accumulated other comprehensive loss (718) (704) Treasury stock, at cost, 778 shares at January 29, 2023 and 757 shares at January 30, 2022 (87,298) (80,794) Total stockholders' equity (deficit) 1,562 (1,696) Total liabilities and stockholders' equity $ 76,445 $ 71,876 See accompanying notes to consolidated financial statements. in millions Common Stock: THE HOME DEPOT, INC. CONSOLIDATED STATEMENTS OF STOCKHOLDERS' EQUITY Balance at beginning of year Shares issued under employee stock plans, net Balance at end of year Paid-in Capital: Fiscal 2022 Fiscal 2021 Fiscal 2020 90 $ 89 $ 89 1 90 90 89 Balance at beginning of year 12,132 11,540 11,001 Shares issued under employee stock plans, net 94 194 229 Stock-based compensation expense 366 398 310 Balance at end of year 12,592 12,132 11,540 Retained Earnings: Balance at beginning of year Net earnings Cash dividends Other Balance at end of year 67,580 58,134 51,729 17,105 16,433 12,866 (7,789) (6,985) (6,451) (2) (10) 76,896 67,580 58,134 Accumulated Other Comprehensive Loss: Balance at beginning of year (704) (671) (739) Foreign currency translation adjustments, net of tax (22) (77) 60 Cash flow hedges, net of tax 9 9 Other, net of tax (1) 35 Balance at end of year (718) (704) (671) Treasury Stock: Balance at beginning of year Repurchases of common stock Balance at end of year (80,704) (65,793) (65,196) (6,504) (15,001) (597) (87,298) (80,794) (65,793) Total stockholders' equity (deficit) $ 1,562 $ (1.696) $ 3,299 See accompanying notes to consolidated financial statements THE HOME DEPOT, INC. CONSOLIDATED STATEMENTS OF CASH FLOWS in millions Cash Flows from Operating Activities: Net earnings Reconciliation of net earnings to net cash provided by operating activities: Fiscal 2022 Fiscal 2021 Fiscal 2020 17,105 $ 16,433 $ 12,866 Depreciation and amortization 2,975 2,862 2,519 Stock-based compensation expense 366 399 310 Changes in receivables, net 111 (435) (465) Changes in merchandise inventories (2,830) (5,403) (1,657) Changes in other current assets (311) (330) 43 Changes in accounts payable and accrued expenses (2,577) 2,401 5,118 Changes in deferred revenue (526) 775 702 Changes in income taxes payable (107) (51) (149) Changes in deferred income taxes 138 (276) (569) 271 196 121 14,615 16,571 18,839 Other operating activities Net cash provided by operating activities Cash Flows from Investing Activities: Capital expenditures Payments for businesses acquired, net Other investing activities Net cash used in investing activities (3,119) (2,566) (2.463) (421) (7,780) (21) 18 73 (3.140) (2,969) (10,170) Cash Flows from Financing Activities: (Repayments of) proceeds from short-term debt, net (1,035) 1,035 (974) Proceeds from long-term debt, net of discounts 6,942 2.979 7,933 Repayments of long-term debt (2,491) (1,532) (2,872) Repurchases of common stock (6,696) (14,809) (791) Proceeds from sales of common stock 264 337 326 Cash dividends (7,789) (6,985) (6,451) Other financing activities Net cash used in financing activities (188) (10,993) (145) (19,120) (154) (2,983) Change in cash and cash equivalents Effect of exchange rate changes on cash and cash equivalents Cash and cash equivalents at beginning of year 482 (68) 2,343 (5.518) 5,686 (34) 76 7,895 2,133 Cash and cash equivalents at end of year $ 2,757 $ 2,343 $ 7,895 Supplemental Disclosures: Cash paid for income taxes $ 5,435 $ 5,504 $ 4,654 Cash paid for interest, net of interest capitalized 1,449 1,269 1,241 Non-cash capital expenditures 351 421 274 See accompanying notes to consolidated financial statements Statement of Cash Flows Indicators Use the information in Home Depot's Fiscal 2022 Consolidated Statements of Cash Flows to calculate the three Statement of Cash Flows Indicators. In the left-hand column enter the names of the items that will be used in the calculation. Enter the financial statement dollar amounts in millions of dollars as shown on the Consolidated Statements of Cash Flows. Round the decimal results to 2 decimal places. xx.xx Fix xx.xx Cell Formats (Quality of Income Ratio) 2022 2021 Cash Flow to Net Income Ratio Sxxxxx.XXX Cash Flow from Operation Activities to 1 1.01 Net Income $17,105 $xXxXxXxXxXxXxXxXx xx.xx (Cash Flow Adequacy Ratio) Cash Flow to Capital Expenditures Ratio $xxx.xxx Net Cash from Operating to 11 6.46 Net Cash Paid to Purchase PP&E xx.xx $xxxxXxXxXxXx Free Cash Flow $xXxXxXxXxXxXxXxXxXx Operating Cash flow Net Cash Paid to Purchase PP&E Cash Dividend Paid Free Cash Flow $7,020 Pg6 Pg7 P98 Pg9 Pg10 Pg11 (Quality of Income Ratio) 2022 2021 Cash Flow to Net Income Ratio Cash Flow from Operation Activities Net Income 101 $17,105 (Cash Flow Adequacy Rato) Cash Flow to Capital Expenditures Ratio Net Cash from Operating Net Cash Paid to Purchase PP&E Free Cash Flow Operating Cash fow Net Cash Paid to Purchase PP&E Cash Dividend Paid 646 Tip Free Cash Flow $7.020 et Cash Paid to Purchase PPS is equal to "Capital Exper mis a positive number
Step by Step Solution
There are 3 Steps involved in it
Step: 1

Get Instant Access to Expert-Tailored Solutions
See step-by-step solutions with expert insights and AI powered tools for academic success
Step: 2

Step: 3

Ace Your Homework with AI
Get the answers you need in no time with our AI-driven, step-by-step assistance
Get Started


